Version
Monitoring (Operations Dashboard)
Overview
The Operations Dashboard provides an overview of the state of data processing on CloverDX Server or Cluster. It helps to quickly identify business processes that are encountering issues, or to quickly confirm that they are successfully passing. The Operations Dashboard displays the state of Monitors, where each Monitor automatically checks and reports the state of data processing represented by some selected automations such as Event Listeners, Schedules and Data Services.
Figure 60. Operations Dashboard
The Operations Dashboard is an entry point to start analyzing issues in the data processing. From simple display that some issue is occurring it allows you to quickly drill-down to the specific failure to analyze and fix it, e.g. a failed graph triggered by a Schedule.
Information shown on the Operations Dashboard is provided via a public REST API that can be used to implement your own dashboard or to integrate with a 3rd party monitoring solution.
Quickstart
The Operations Dashboard is the default landing page of the Server. It shows Monitors as tiles, where each Monitor represents some data processing (typically for a business process). The Monitors automatically watch the state of selected items of automation - Schedules, Event Listeners or Data Services. These items perform the data processing needed by the business process.
Multiple Dashboards can be defined, with the default Main dashboard being available automatically. You would typically create additional Dashboards for specific projects or areas of responsibility in the team. Each Dashboard has its own Monitors, i.e. each Monitor belongs only to one Dashboard.
The Operations Dashboard refreshes automatically every few seconds, so it’s not necessary to refresh the browser window to see the current state.
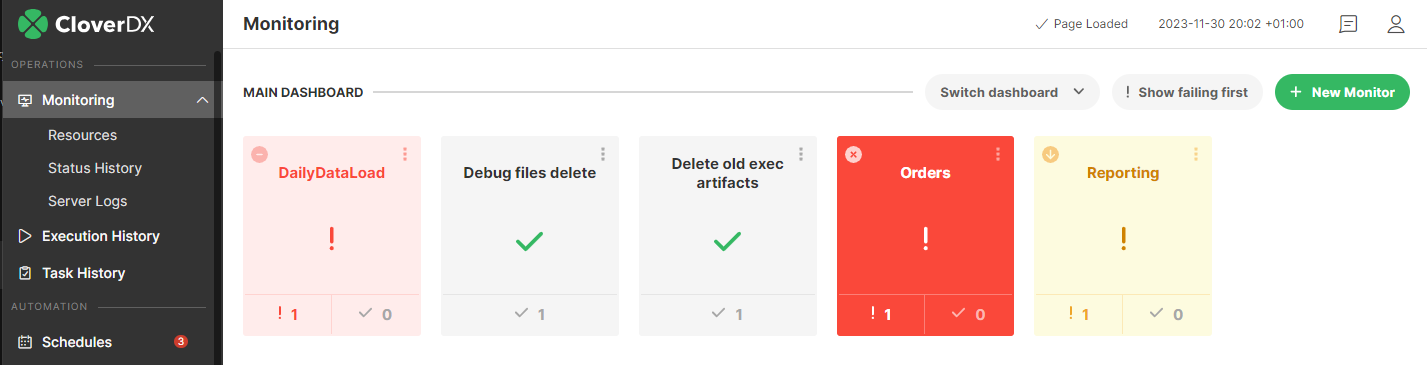
Figure 61. Operations Dashboard
Tiles of Monitors show the following information:
-
Name - name of the Monitor, specified when creating it
-
State icon - failing / passing. A Monitor is shown as failing in case any of the items watched by the monitor are failing.
-
Alert level - indicates the highest Alert Level of all failing triggers in this monitor. Alert level is displayed by background color and icon in the top-left corner.
-
Warning icon - a warning icon in top-left indicates that the Monitor was failing recently, but currently is passing. You should investigate the recent issues and manually acknowledge them to dismiss the warning.
-
Number of failing and passing items - how many of the watched items are passing and how many are failing. These numbers give you a more detailed overview of the health of the Monitor, for example if just 1 item is failing but a large number of items are passing, then the issue is probably of lesser criticality.
Selecting a Monitor shows details about it:
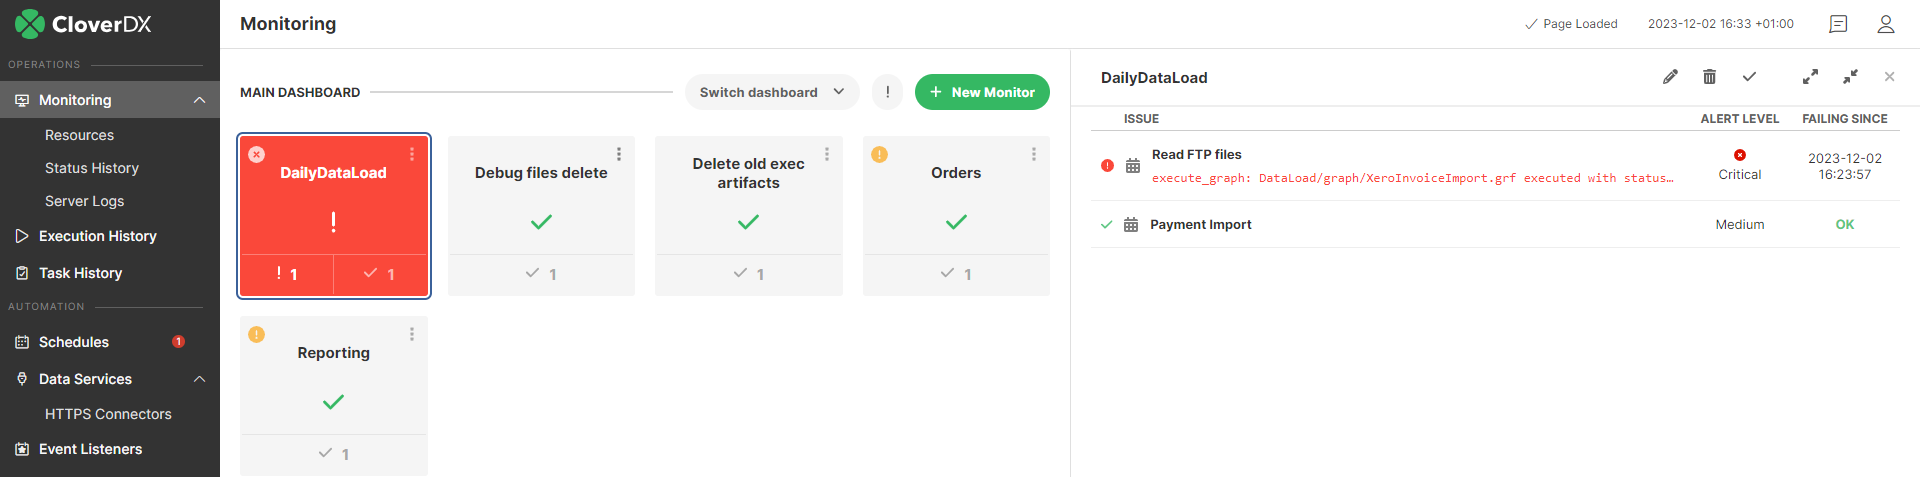
Figure 62. Monitor details
Each monitor watches some items that automate data processing in the Server (Event Listeners, Schedules, Data Services). In the details of the Monitor you can see all the items with the following information:
-
Name - name of the item, e.g. name of the watched Schedule
-
Error message - if the item is failing, this is the last error message it returned. For example it would be the reason why a job triggered by a Schedule failed.
-
Warning message - if the item was failing recently but it’s passing now, this is the last error message it returned. This is useful information to understand what was happening with the data processing e.g. in the last few days. The warning message disappears when you manually mark the issue as resolved (see Operations Dashboard - Issue Investigation).
-
Alert level - Alert Level of the trigger.
-
Failing since - when did the item start failing
-
Actions - actions on the whole Monitor - you can modify the Monitor, remove it, mark all issues as resolved, and expand/collapse details about all of the items.
Using the Dashboard
Dashboard
The Operations Dashboard is the landing page of CloverDX Server designed to quickly show the state of data processing (typically for a business process). It shows Monitors and their state, where each Monitor watches the state of several items that automate data processing (i.e. Schedules, Event Listeners, Data Services). These items perform the data processing needed by the business process.
Figure 63. Operations Dashboard
|
The Operations Dashboard was introduced with CloverDX 5.8. In previous versions the landing page showed information about load, resources, running jobs etc. That page was moved to the Resources page under Monitoring, see Resources for more details. |
Multiple Dashboards can be defined. This is useful in more complex deployments, where each Dashboard could cover a separate project, area of responsibility of a specific team etc. Each of the Dashboards has its own set of Monitors (i.e. a Monitor belongs to just one Dashboard, it cannot be shared). There is one default Dashboard provided by default - Main Dashboard. Name of the currently selected Dashboard is shown in the top-left corner of Operations Dashboard.
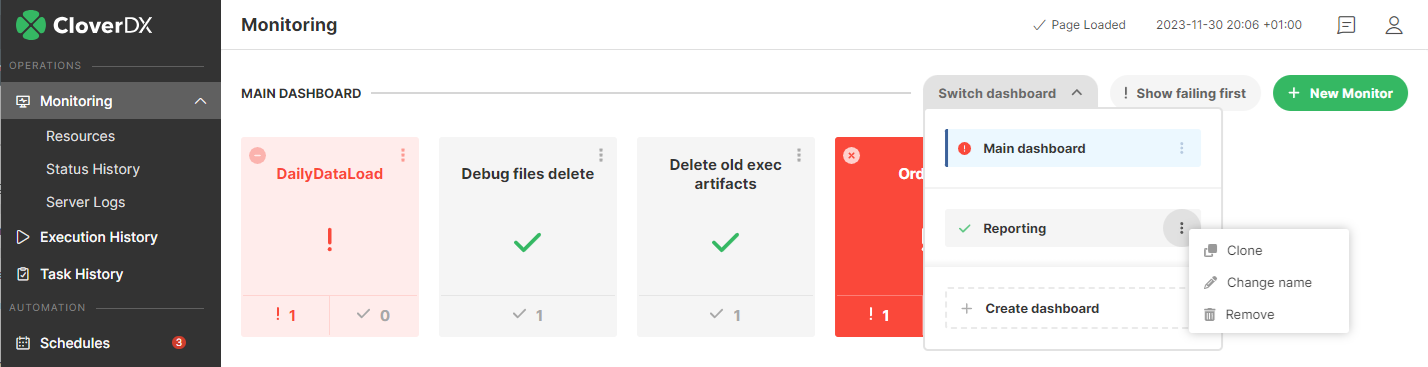
Figure 64. Multiple Dashboards
Switching between Dashboards is done via the Switch Dashboard widget at the top right. The Switch Dashboard widget provides also actions for Dashboards:
-
Create dashboard - creates a new Dashboard, you must specify its name.
-
Change name - renames a Dashboard.
-
Clone - copies the Dashboard to a new Dashboard. The new Dashboard will have the same Monitors and configuration. The Monitors are not shared between Dashboards, so change in a Monitor in the cloned Dashboard will not affect the original Dashboard. This action is useful to create a new Dashboard based on an existing one and then configure it further.
-
Remove - deletes the Dashboard. The default Main Dashboard cannot be deleted.
If some Monitors are failing, they are highlighted in red color. With the Show failing first button, it’s possible to switch the dashboard to a visualization mode where the failing Monitors are shown at the top. This is useful with a larger number of Monitors to see all the failing ones at the top.
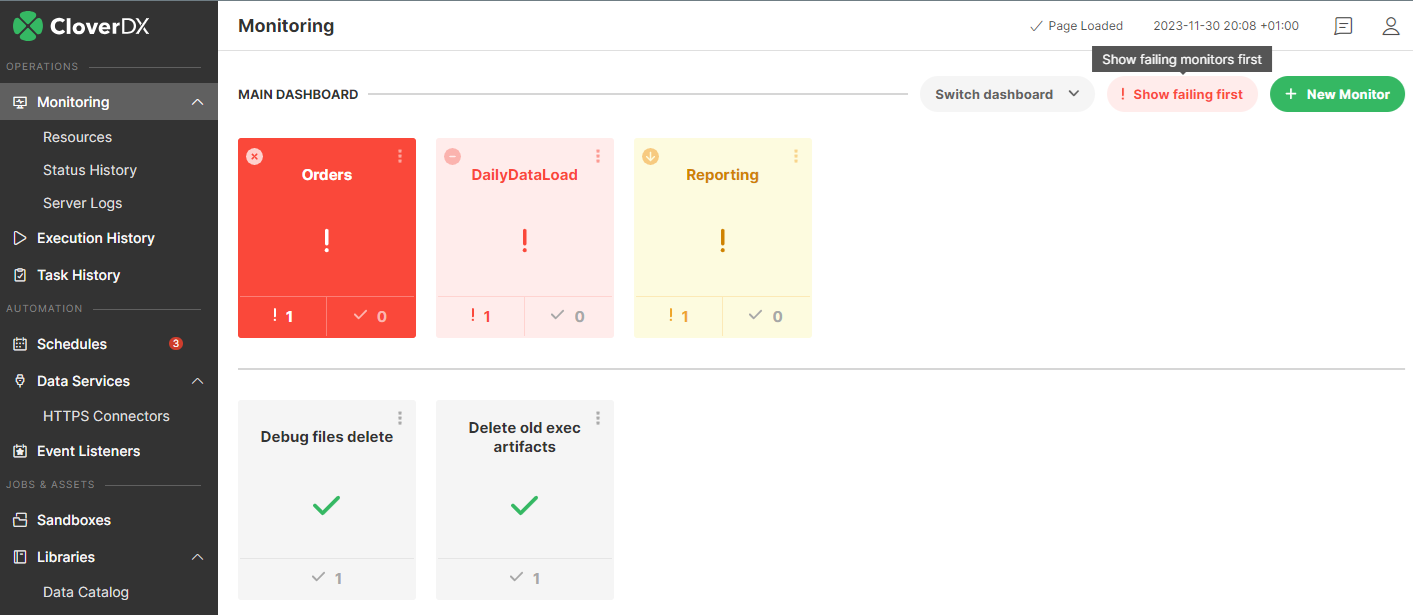
Figure 65. Failing Monitors on top
The dashboard shows all Monitors as tiles, providing the following information:
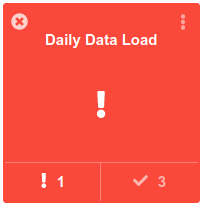
Figure 66. Monitor tile
-
Name - name of the Monitor, specified when creating it. Names of Monitors are unique.
-
State icon - failing / passing. A Monitor is shown as failing in case any of the items watched by the monitor are failing.
-
Alert level - indicates the highest Alert Level of all failing triggers in this monitor. Alert level is displayed by background color and icon in the top-left corner.
-
Warning icon - a warning icon in top-left indicates that the Monitor was failing recently, but currently is passing. You should investigate the recent issues and manually acknowledge them to dismiss the warning.
-
Number of failing and passing items - how many of the watched items are passing and how many are failing. These numbers give you a more detailed overview of the health of the Monitor, for example if just 1 item is failing but a large number of items are passing, then the data processing represented by this Monitor has probably only a minor issue.
The three-dot button is used to perform actions on the Monitor:
-
Show details - selects the Monitor and shows details about it and its items. This is the same as clicking on the Monitor tile.
-
Edit - opens a dialog to modify the Monitor, e.g. to add or remove its items
-
Mark as resolved - manually marks all issues in the Monitor as resolved (see Operations Dashboard - Issue Investigation)
-
Remove - deletes the Monitor from the dashboard. The items of the Monitor are not affected by this action, i.e. deleting a Monitor does not delete its watched Schedules.
Monitor
The Monitors are designed to represent data processing of a business process. They allow you to quickly see the health of the data processing, even though it can be implemented by a wide range of functionality - running jobs from Schedules, triggering them via Event Listeners or using Data Services (or Data Apps). Monitor can be used to guard Schedules, Event Listeners and Data Services from one or more sandboxes.
Monitors watch the health of data processing by watching the state of automations represented by items:
-
Schedules
-
Event Listeners
-
Data Services
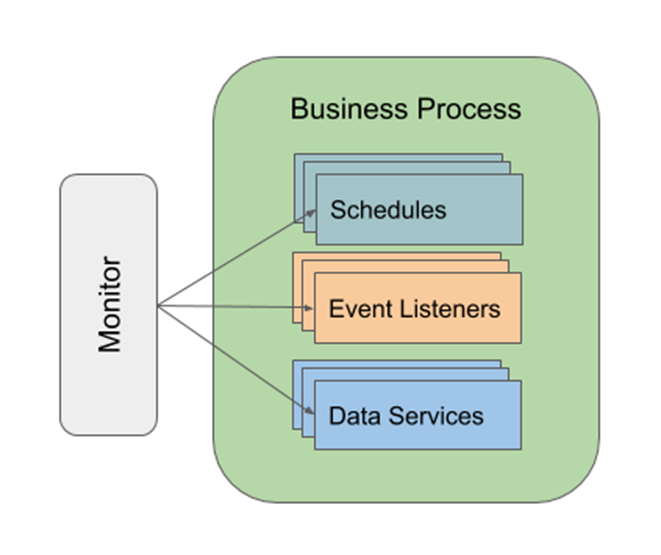
Figure 67. Monitor
All of the automations that can be watched by a Monitor provide a similar concept of state. They can be configured to report as failing when certain conditions are met (see Alerts and Notification). Typical cases:
-
On each failure - e.g. each failure of a graph marks its schedule as failing
-
On a number of consecutive failures - e.g. 10 failures of a Data Service invocation in a row mark it as failing
-
On a % of failures during a time interval - e.g. if 50% calls of a Data Service fail within one minute, then it’s marked as failing.
The more complex failure configurations are typically used for frequently called automations - for example API implemented by a Data Service would be considered as failing only when 10 calls of the Data Service fail in a row. On the other hand, scheduled run of an important job that performs daily load of data would be considered as failing immediately when the job fails.
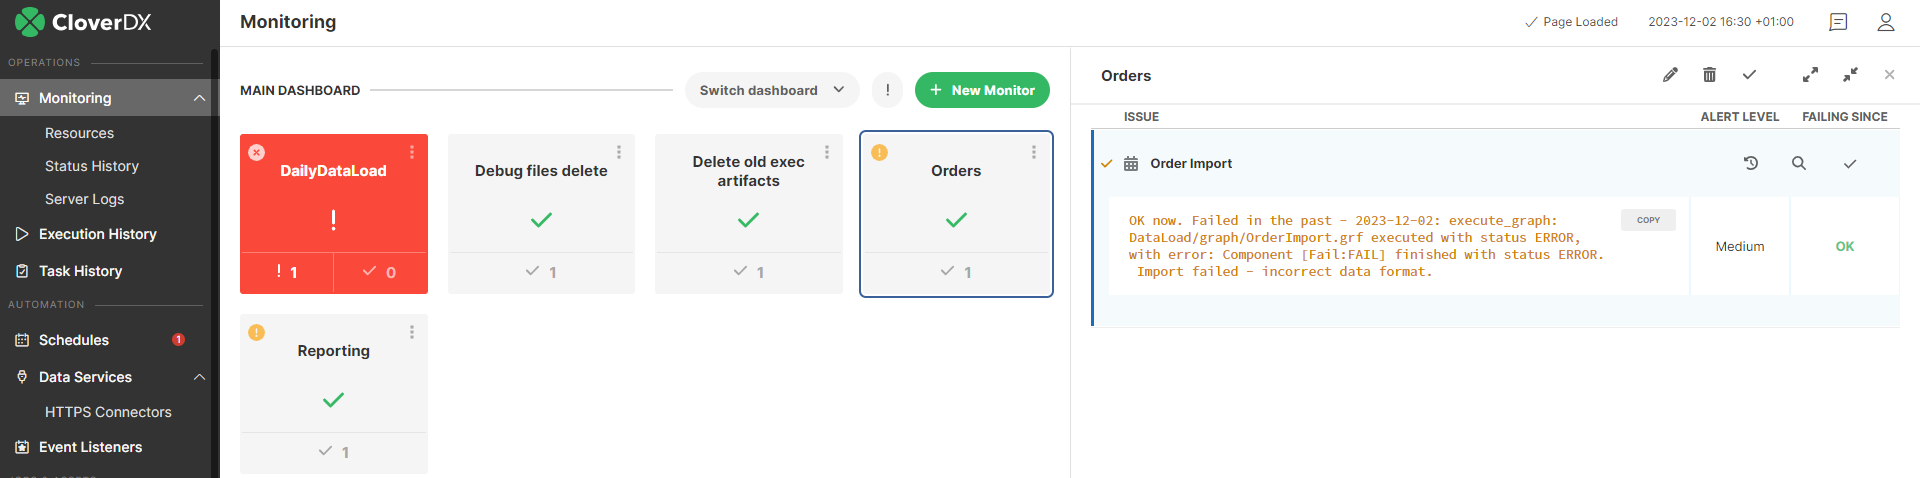
Figure 68. Monitor Warning
If a Monitor starts to fail and then returns to passing state, it stays in a warning state. This feature is designed to prevent missing important failures in the past - for example, there can be outages during the weekend that stop happening and would be missed by support team on Monday. When you select a Monitor in the warning state, you will find warning details in some of its items. To acknowledge that the warning is handled, mark the issue as resolved (see Operations Dashboard - Issue Investigation).
Issue Investigation
To drill down to details about a failure, select a Monitor in the dashboard to see a list of its items:
Figure 69. Monitor detail
You can click on an item to see more of the error message and to see available actions. The Show action (e.g. Show Schedule) will navigate you to the configuration of the affected item - e.g. it will show you the configuration of the affected Schedule. From there you can analyze the issue in more detail, check the configuration of the item, go to the history of executions of the automation etc. The Show history action takes you directly to the history of the item, e.g. to history of executions of the specific Schedule.
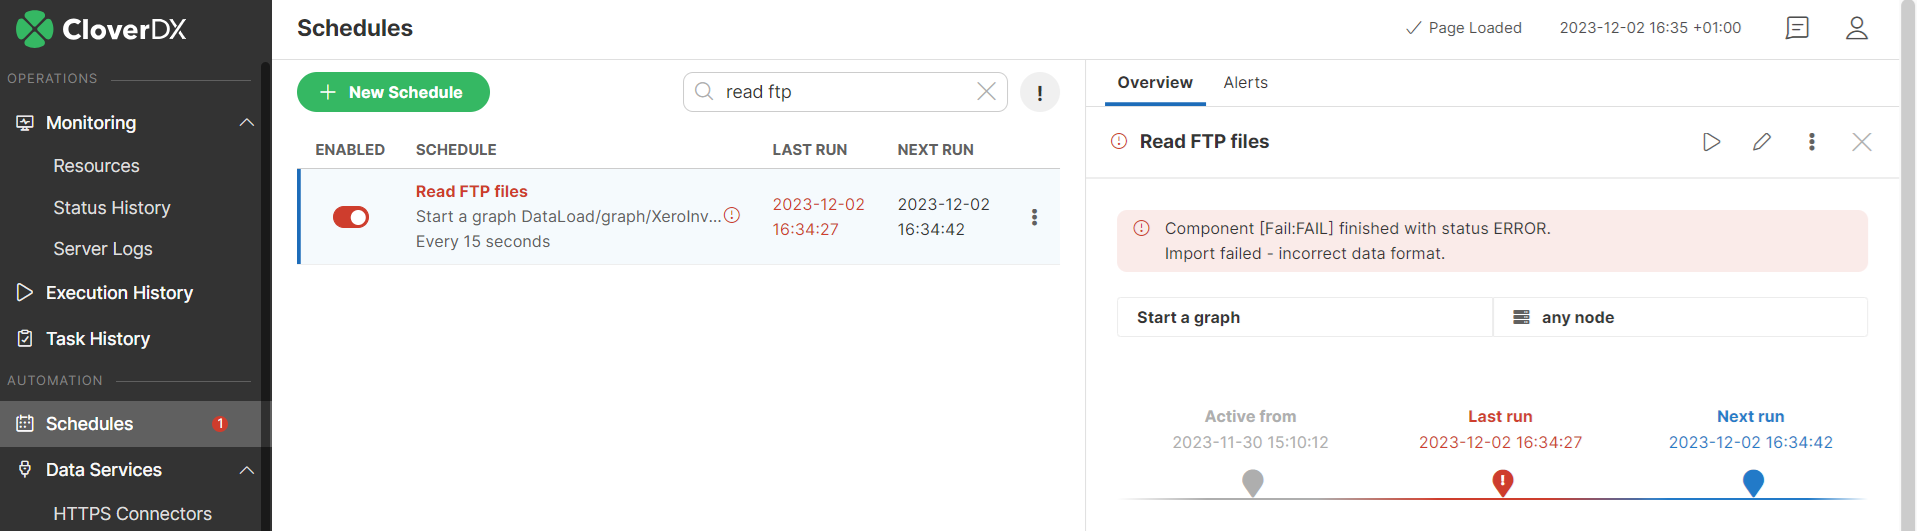
Figure 70. Schedule detail
The Monitors update their state automatically based on the state of their items. So if an item stops failing because of some intermittent issue (e.g. networking problem), its Monitor will automatically stop being marked as failing.
If a Monitor starts to fail and then returns to passing state, it stays in a warning state. This feature is designed to prevent missing important failures in the past - for example, there can be outages during the weekend that stop happening and would be missed by support team on Monday. When you select a Monitor in the warning state, you will find warning details in some of its items. To acknowledge that the warning is handled, mark the issue as resolved , see below for details.
Figure 71. Monitor Warning
It is possible to manually reset the health of an item to mark it as successfully passing - use the Mark as resolved action on the item in Operations Dashboard. This is typically used when you fix the underlying issue that caused the failure (e.g. configuration of a system), but the item will run later and you can mark it as already resolved so that someone else will not spend time on the issue. Resolving all failures resolves the failing state of the Monitor. This action is also used to reset the state of a Monitor in warning state, where an item was failing recently but passes currently. In such case the action indicates that the recent outage was analyzed and handled.
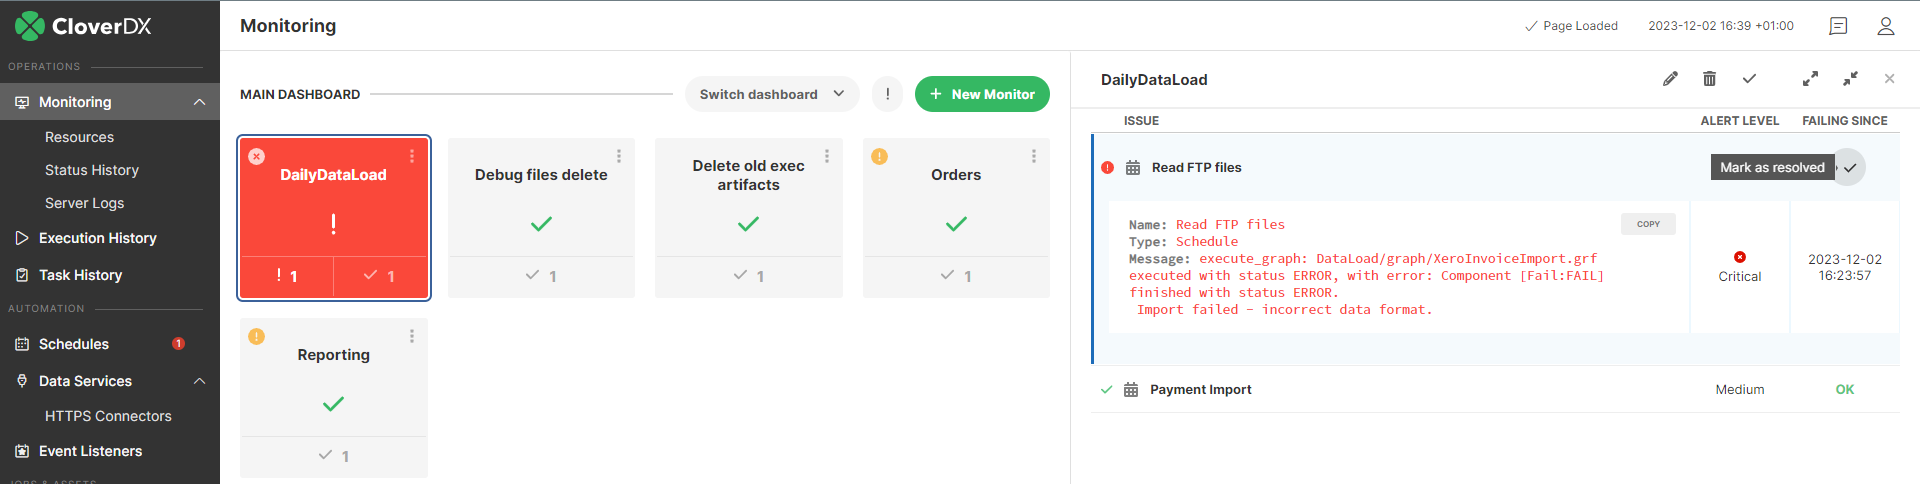
Figure 72. Mark as resolved action
You can use the Mark all as resolved action to resolve all issues in a Monitor:
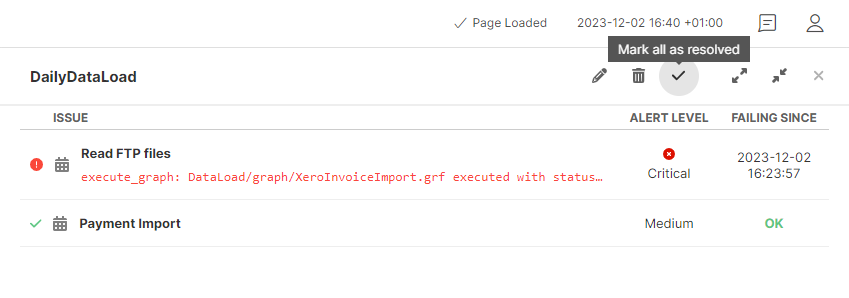
Figure 73. Mark all as resolved action
To analyze history of changes to the state of Monitors, use the Monitor Log. It contains detailed historical information on Monitor health, failing and recovering monitored items and manual reset of item health.
Create & Modify Monitors
Monitors are manually created and the items watched by the Monitors are explicitly selected, i.e. the Monitors are not automatically generated.
Each Monitor belongs to one Dashboard. In case you have multiple Dashboards defined, you create and configure Monitors for the currently selected Dashboard.
Creating a Monitor:
-
Use the Create Monitor tile
-
Use the Monitor all sandboxes tile if no Monitors are created yet. This is a shortcut to automatically create Monitors for all your sandboxes.
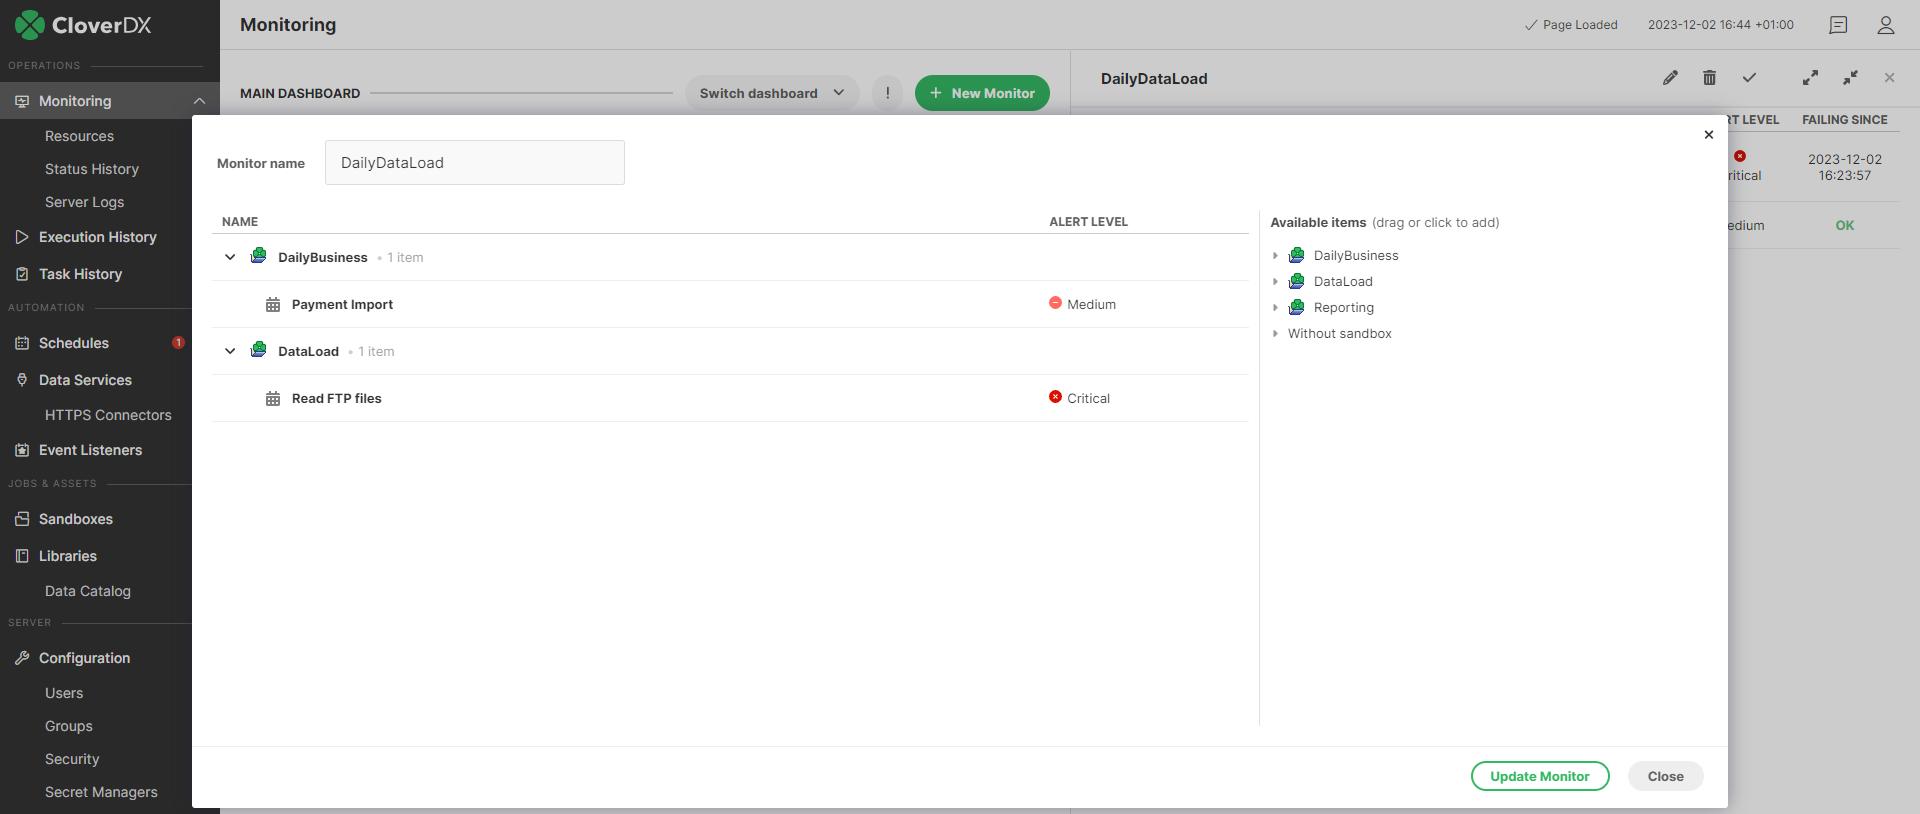
Figure 74. Monitor configuration
When creating a Monitor, you must specify the items it watches. These items perform the data processing or business process represented by the Monitor. To add an item to a Monitor, drag & drop it from the right side to the left. It’s possible to add all items related to a sandbox by dragging & dropping the sandbox, or to add all items of some type by e.g. dragging the Schedules node.
To change configuration of a Monitor, select it and use the Edit action. The edit action is also available in the three-dot button.
Items are not added automatically to a Monitor. For example if you create a new Schedule that runs a job from a sandbox, then you need to update some Monitor to watch the state of the Schedule.
It is possible to import & export the configuration of the dashboard and all its Monitors via the standard Server Configuration Migration feature of CloverDX Server.
Logs
Changes to the state of Monitors are logged in the Monitor Log. The Monitor log tracks changes of Monitors, such as deteriorating or improving health, which items started to fail and which recovered, manual reset of health state of monitored items etc. This allows you to analyze what was happening to your data processing in the past.
For more information, see Monitor Log.

Figure 75. Monitor log
Scenarios
-
Monitor shows high number of failure, low number of successful passes - this typically indicates that the business process represented by the Monitor is encountering a serious issue and should be investigated
-
Complex deployments - in complex deployments with a high number of Monitors, projects, separate teams etc. you can create multiple Dashboards. For example each Dashboard would cover one project, or would be managed by one support team or
-
Tracking of fixes - if an item is failing and you fixed the underlying issue (e.g. fixed configuration of some system, fixed networking etc.) then you can manually mark the issue as resolved (via the Mark as resolved action on the item). This is especially useful if the item will automatically run much later and you need to let other members of your team know that the problem is already fixed.
-
Analyze the issue - if an item is failing, you can use the Show schedule (and similar) action to navigate to its configuration. There you have additional means to analyze the issue - via error message, history of previous executions etc.
-
Initial set-up of Monitors - if you already have data processing set-up on the Server but no Monitors yet, you can use the Monitor all sandboxes action to create an initial set of Monitors for you.
-
Move Dashboard between Server instances - to move configuration of a dashboard between Server instances, use the standard Configuration Migration functionality of CloverDX Server
API
The Operations Dashboard is backed by a modern REST API of the Server. This REST API is public and you can use it to create your own dashboards, integrate with 3rd party monitoring tools etc.
See REST API for more details.
Configuration
The following configuration affects the Operations Dashboard:
-
Permissions - the Operations Dashboard is available for users that have the Monitoring UI and List dashboards and monitors permissions. Moreover if a user has Operations dashboard write access permission, they can create and modify Monitors (for more information about permissions see Groups). It is possible to define minimalistic permissions for users, so that they can use the Operations Dashboard but not have access to Event Listeners, Schedules and Data Services. In such a case the user will be able to see details of Monitors and error messages of the items, but won’t be able change configuration of the items. This setting can be useful for the support team.
-
API configuration - there are configuration properties related to the API, see operations.dashboard.refreshing.interval, operations.dashboard.request.timeout.
Limitations
The Operations Dashboard currently has the following limitations:
-
It monitors only automations as Schedules, Event Listeners or Data Services. It’s not possible to monitor manually (or via API) started jobs
-
Newly created automations (e.g. Schedules) are not automatically added to any Monitor - you need to manually add them to some monitor.