Version
Server Logs
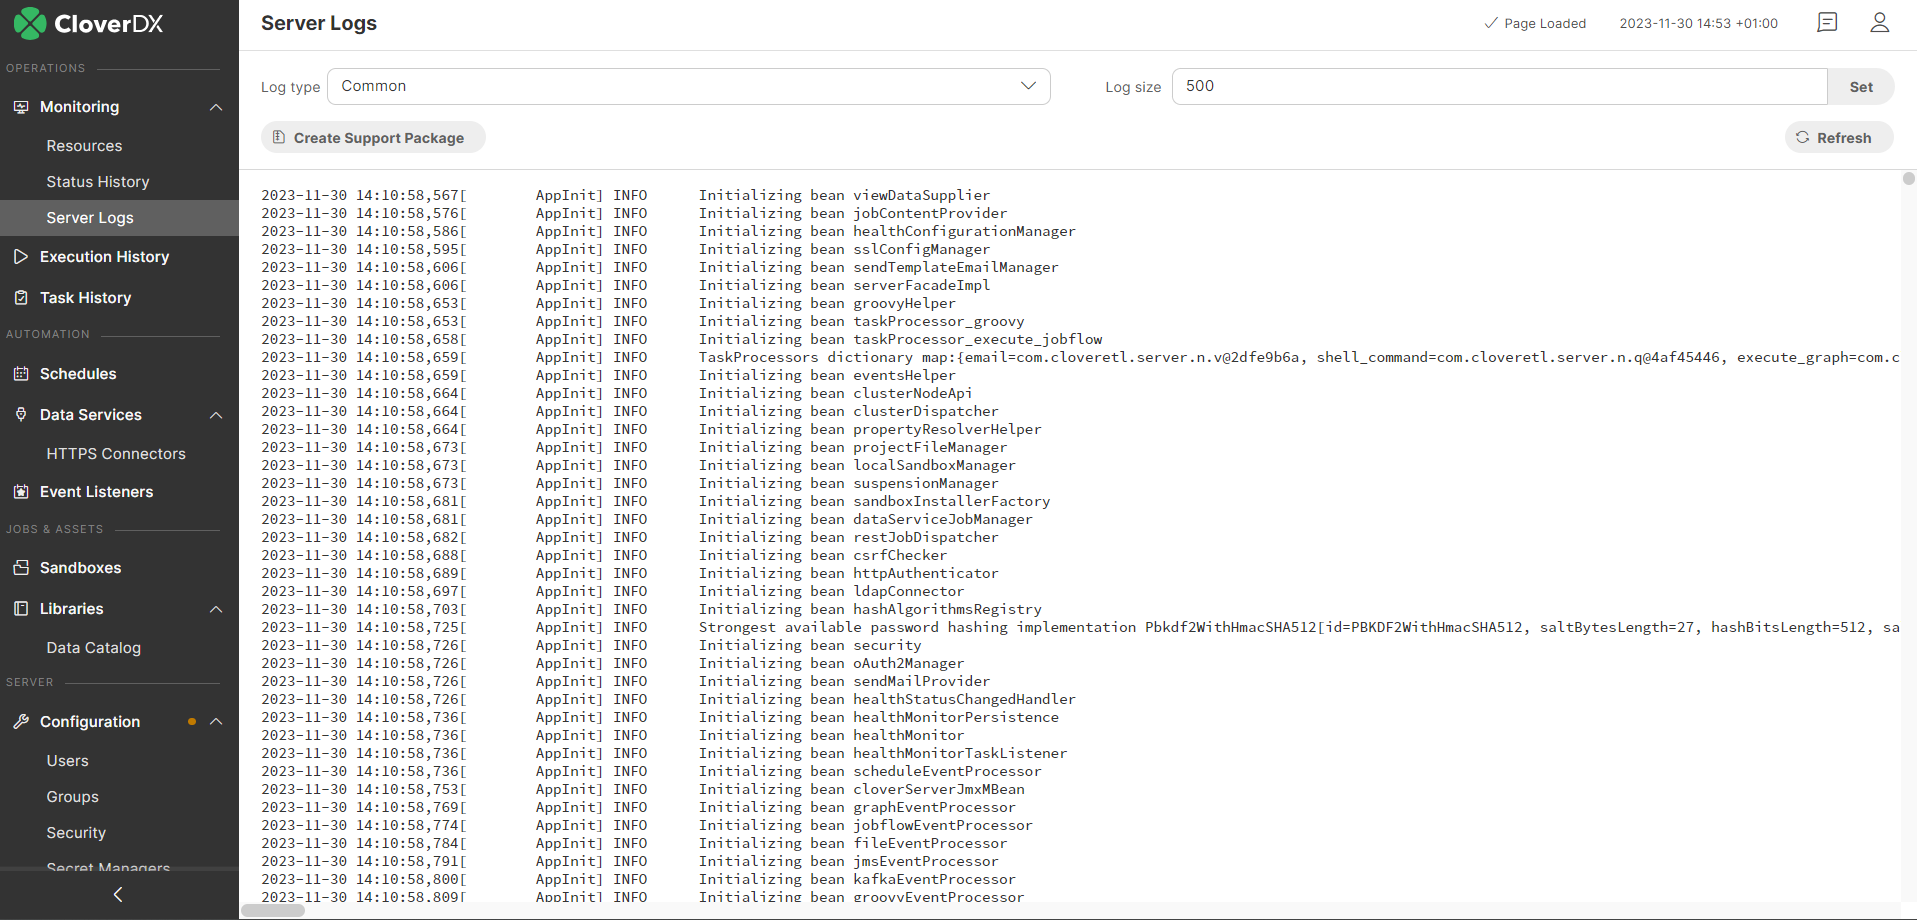
The Server Logs section allows you to quickly display the latest CloverDX Server log messages. In a Cluster environment, users can select a node to display the log files for. Since the log messages that are displayed in this section are collected in memory, the maximum number of messages is relatively low by default, but it can be easily changed by modifying the value in the Log size field and clicking on the Set button.
By clicking on the Create Support Package button, you will be redirected to the System Info section under Configuration, where you can easily generate a Support Package, which will allow you to automatically zip up and download the full log files.
For more information on what type of logging is used in CloverDX Server, how it can be modified, and how to read the log files, see Logging.
The full log files, in plain text format, reside on the server in a directory defined by configurable parameters. See Logs Directory for more information.
The following Log types are available to be displayed:
-
COMMON - displays information related to Server core and worker processes, start and end times of job executions, successful and unsuccessful logins, etc.
The file name of the related log file in the filesystem is
all.log. -
WORKER - displays worker-related information (e.g. when a worker process was stopped or started, and it lists job start and end times).
The file name of the related log file in the filesystem is
worker-[node_name].log. -
CLUSTER - displays Cluster-related messages. It contains information on job delegation across nodes and other types of messages related to Cluster communication.
The file name of the related log file in the filesystem is
node.log. -
DATA SERVICES - displays information related to data services, e.g., login information, target URI, IP address, or returned HTTP code.
The file name of the related log file in the filesystem is
data-service.log. -
AUDIT - displays information about operations triggered by the CloverDX Server core, e.g., job execution calls. This log is disabled by default. Refer here for more information about how to enable it and what kind of information it logs.
The file name of the related log file in the filesystem is
server-audit.log. -
USER ACTIONS - displays user-related operations, e.g. login, logout, user creation, and file synchronization triggered by changes in Server projects.
The file name of the related log file in the filesystem is
user-action.log. -
SERVER INTEGRATION - displays information related to the interaction between CloverDX Designer and Server.
The file name of the related log file in the filesystem is
server-integration.log. -
PERFORMANCE - displays performance-related information, e.g. heartbeat age between core and worker, used worker and core heap space, system, core and worker CPU, or worker and core uptime. More information about how to read this log file can be found here.
The file name of the related log file in the filesystem is
performance.log. -
JOB QUEUE - displays information related to jobs processing, e.g., the number of currently queued and running jobs, and the current system CPU.
The file name of the related log file in the filesystem is
job-queue.log. -
MONITOR - displays information related to monitors, e.g., creation and deletion of monitors, changes in monitor states, or the number of failing items in monitors.
The file name of the related log file in the filesystem is
monitor.log.
Figure 96. Server Logs