Version
70. Creating a Transformation Graph
- Terminology
- Creating a Project
- Creating a New Data File
- Creating a Graph
- Placing Components in the Graph Editor Pane
- Connecting Components by an Edge
- Extracting Metadata from the Input File
- Assigning Metadata to the Edges
- Setting Up Readers (FlatFileReader)
- Setting Up Writers (SpreadsheetDataWriter)
- Running the Graph
- Opening the Output File
This chapter explains the basics of CloverDX projects and shows you way to create a simple graph that reads records from a CSV file and writes them to a .xlsx file.
Instead of reading this chapter, you can try the Tutorial that is available in the product after the first start in a new workspace or watch a video tutorial.
Terminology
Before creating a transformation graph we will explain some terms we use in this tutorial.
-
A workspace is a directory on your computer where your save your projects. It also contains per-workspace configuration. You have chosen it during the start of Designer.
-
A project is a directory in workspace. It is the location where you place data transformations and data.
-
A graph , or a transformation graph, is a recipe to data transformation. The graph consists of components which are connected by edges.
Creating a Project
We assume that you have downloaded and installed CloverDX Designer.
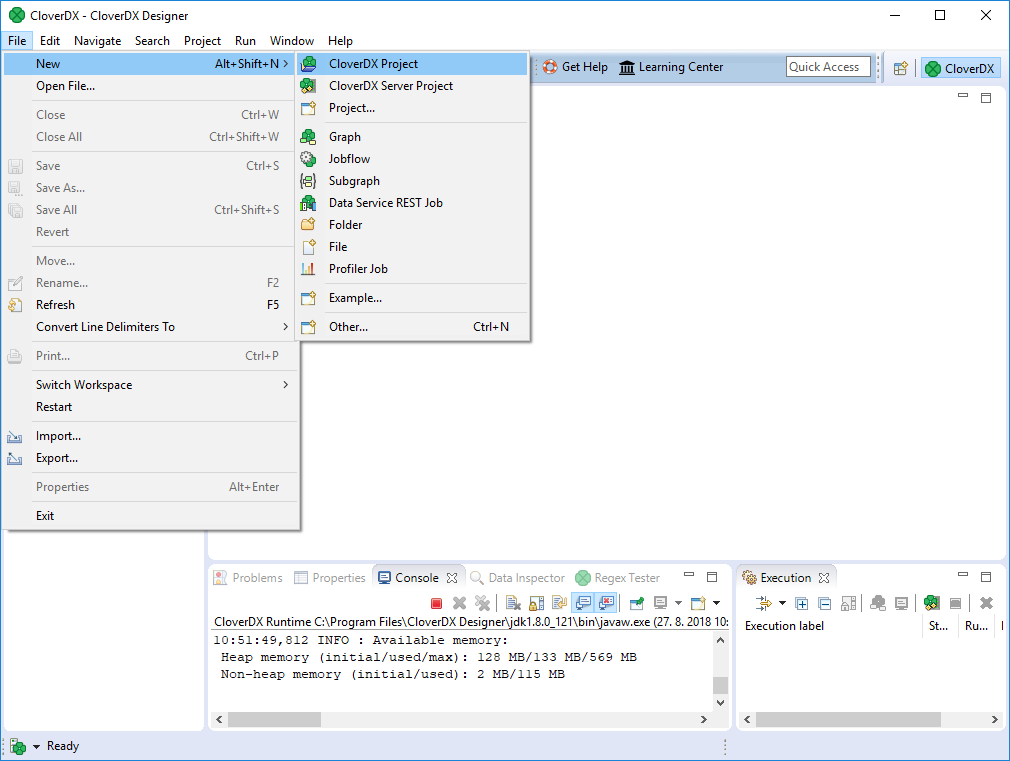
It is the right time to create a new project now. Select from the main menu:
Figure 481. Creating a New CloverDX Project
Type the name of the project, e.g. Project_01.
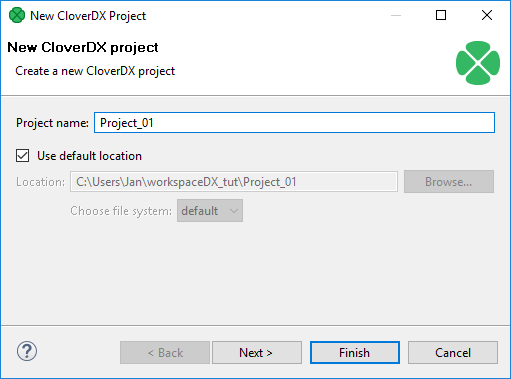
Figure 482. Selecting a Name of a New Project
Creating a New Data File
Now you need a data file. You probably have some. If not, you can create an example file as shown below.
The best practice is to place your input data into data-in.
Right-click data-in item in the Project Explorer pane and select from the context menu.

Figure 483. Creating a Flat Data File
Type file name, e.g. input.dat.
It will be created and stored in the highlighted data-in subfolder.

Figure 484. Selecting a Folder for the Data File
The file will be created and opened.

Figure 485. Still Empty Data File
Enter some data records in this file; for example, copy and paste the lines below (make sure there is an empty line at the end):
John;Smith;25000
Peter;Brown;30000
George;Hardy;20000
Richard;Gordon;22000
Mark;Taylor;40000
Michael;Lester;18000
George;Smith;30000
Albert;Brown;30000

Figure 486. Filling the Graph with Delimited Data Records
Now you will create your graph.
Creating a Graph
After creating a new project, create a new graph: select from the main menu. The graph is a recipe of your data transformation.
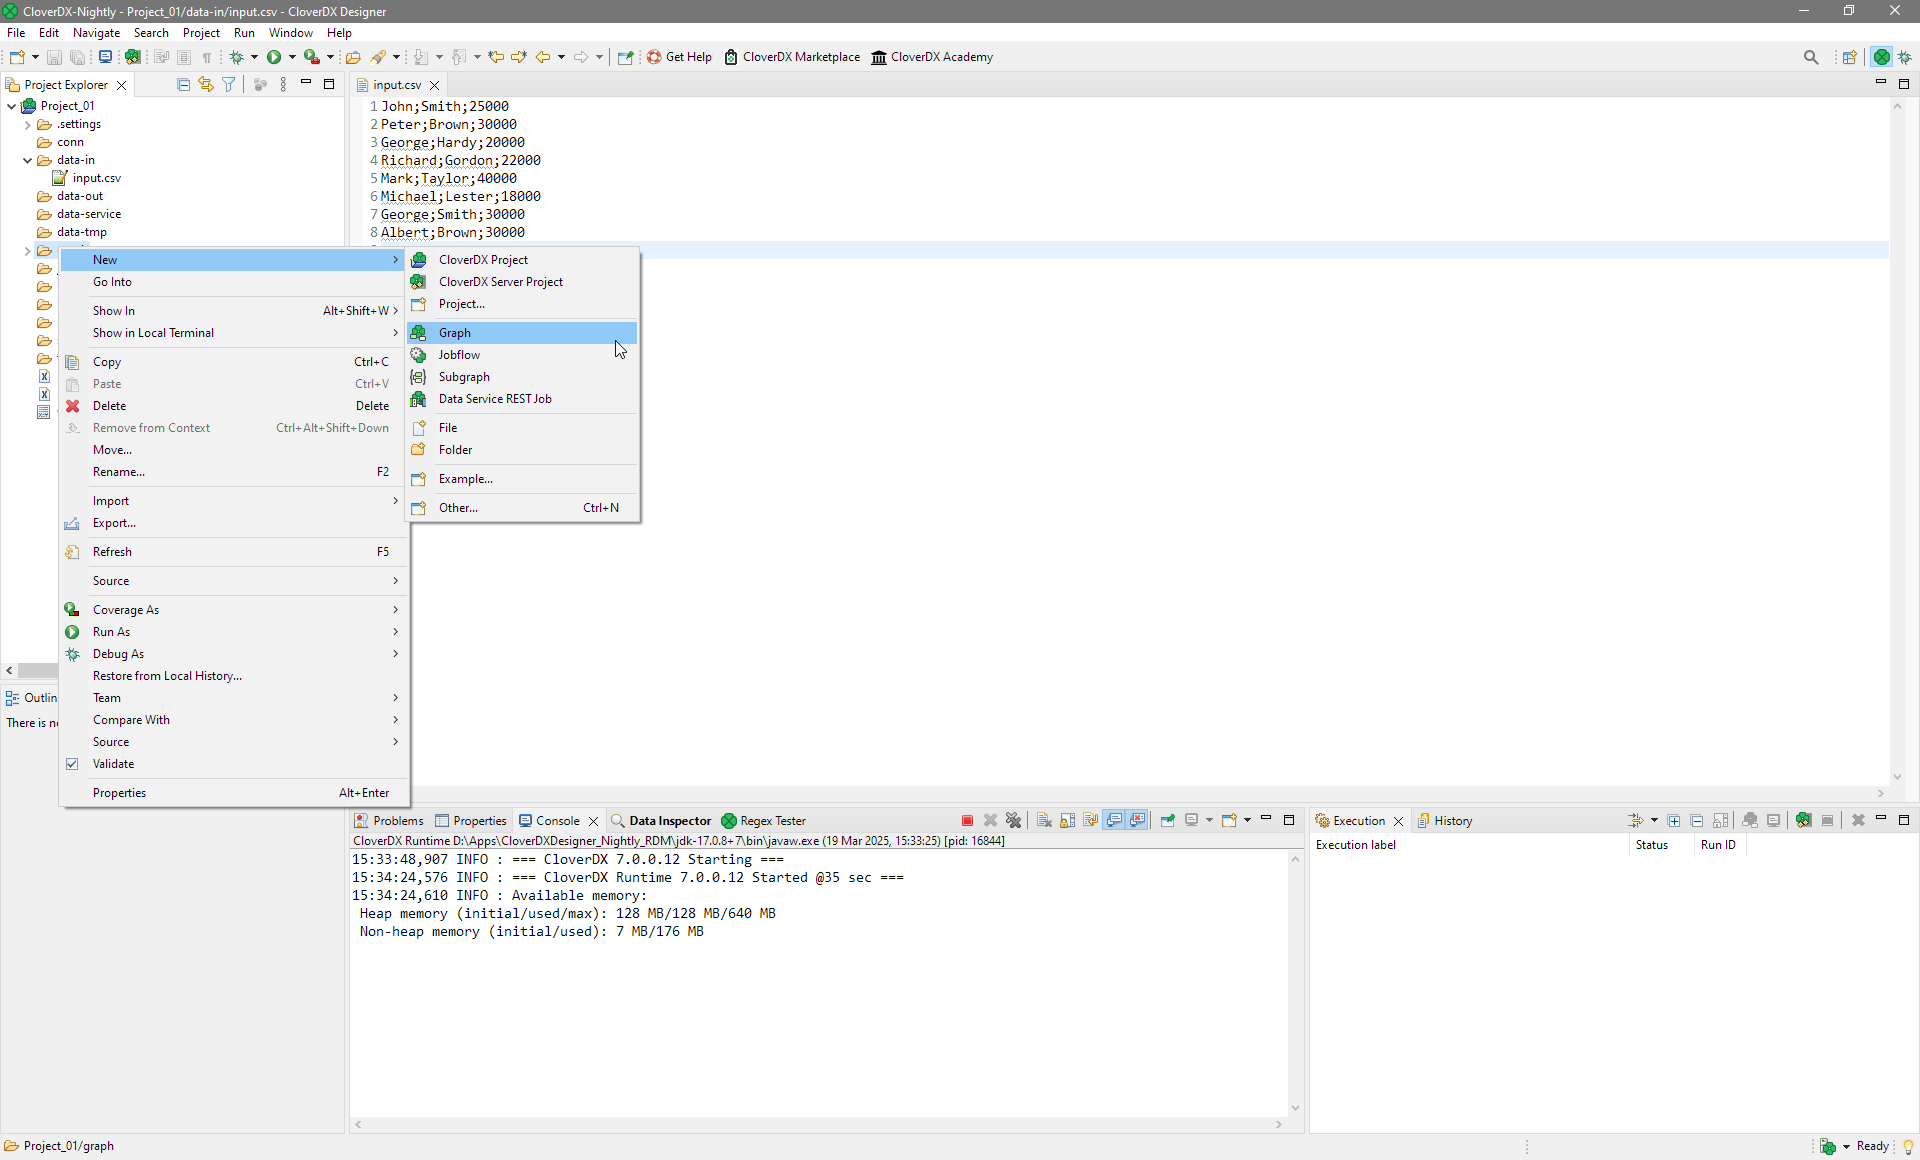
Figure 487. Creating a New Graph
Give a name to the graph and choose a directory for it.
We choose graph as the graph name. CloverDX Designer gives it the .grf extension automatically.
CloverDX Designer offers the graph subfolder.
It is the recommended place for graphs.

Figure 488. Selecting a Folder for the Graph and a Name of a New Graph
Placing Components in the Graph Editor Pane
To create a graph, select right components from Palette of Components and place them in the Graph Editor pane. Palette of Components on the right side of the Graph Editor pane.
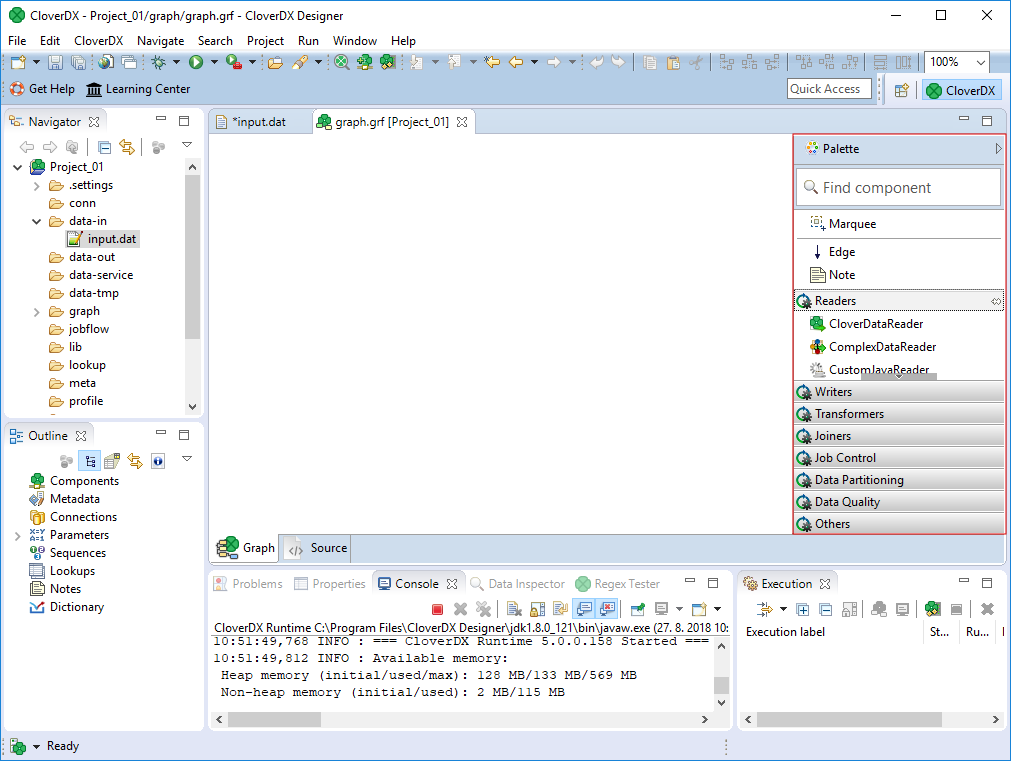
Figure 489. Selecting Components for the Graph
If Palette is not displayed, click an arrow in the right top of the Graph Editor pane. This way the Palette will remain opened until you fold it.
Find FlatFileReader label in the Palette among Readers. Drag FlatFileReader from Palette into Graph Editor pane.
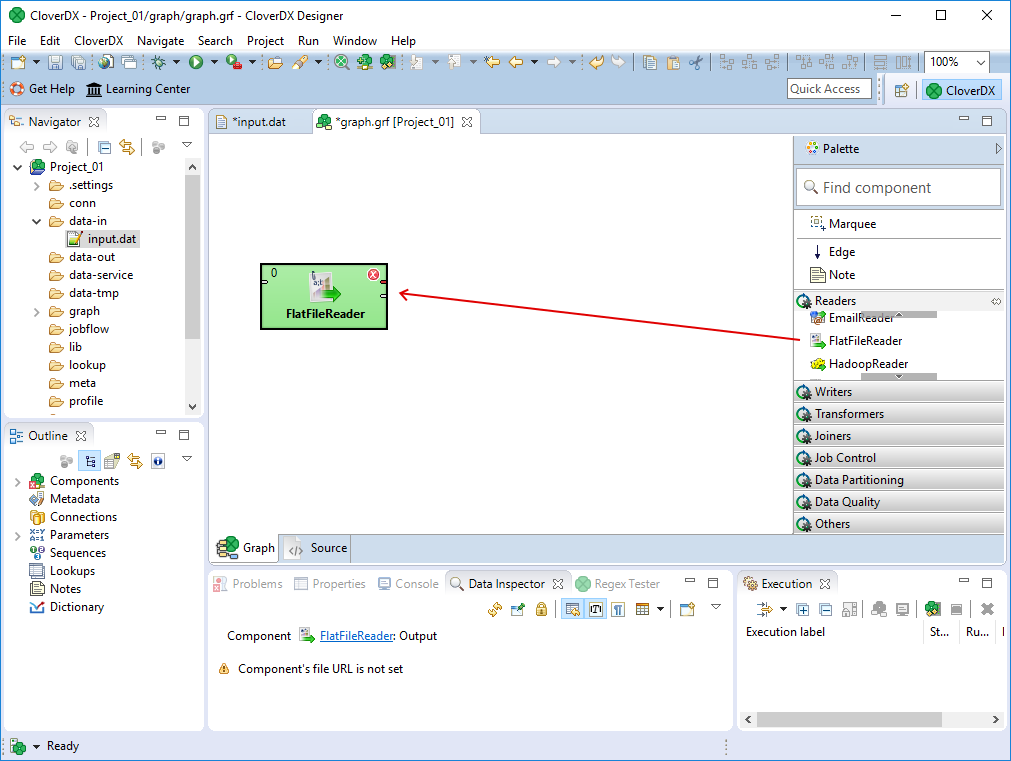
Figure 490. Placing the First Component to the Graph Editor Pane
Do the same with the SpreadsheetDataWriter component from Writers. Put these components in the Graph Editor from left to right.
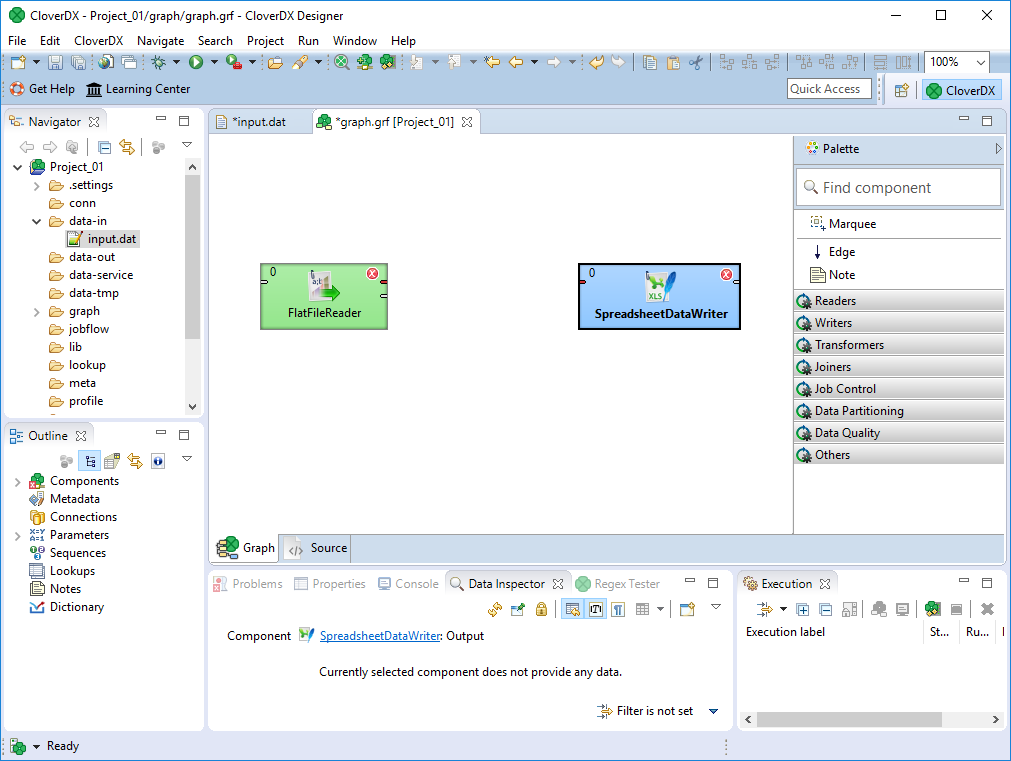
Figure 491. Placing the writer component
If you know the component name, you can add component using Add Component dialog. Press Shift+Space within graph editor and start typing the name.
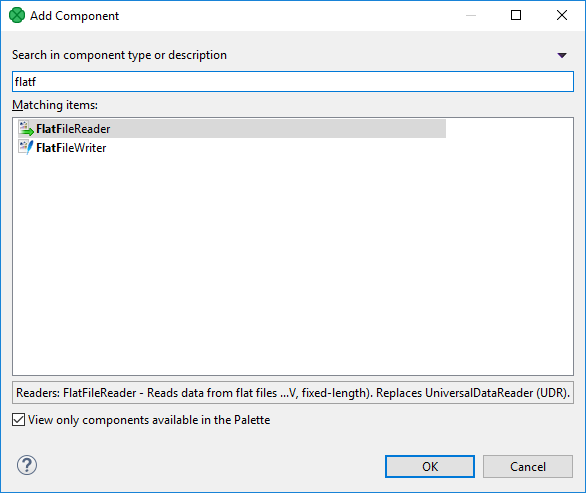
Figure 492. Add Component Dialog
Connecting Components by an Edge
Click the first output port of FlatFileReader.

Figure 493. Connecting Components by Edges
An edge appears connected to the output port of the component. Now click inside the Filter component near its input port.

Figure 494. Connecting Components by Edges
The edges are still red and dashed since no metadata are assigned to them.
If you missed the port, a dialog for adding a new component would appear.
I the next step we will assign metadata to the edge.
Extracting Metadata from the Input File
Metadata is data describing the data structure.
You can extract metadata from your flat data file or create it by your own. We will show you, how to extract it from input file.
Right-click the first edge and select .
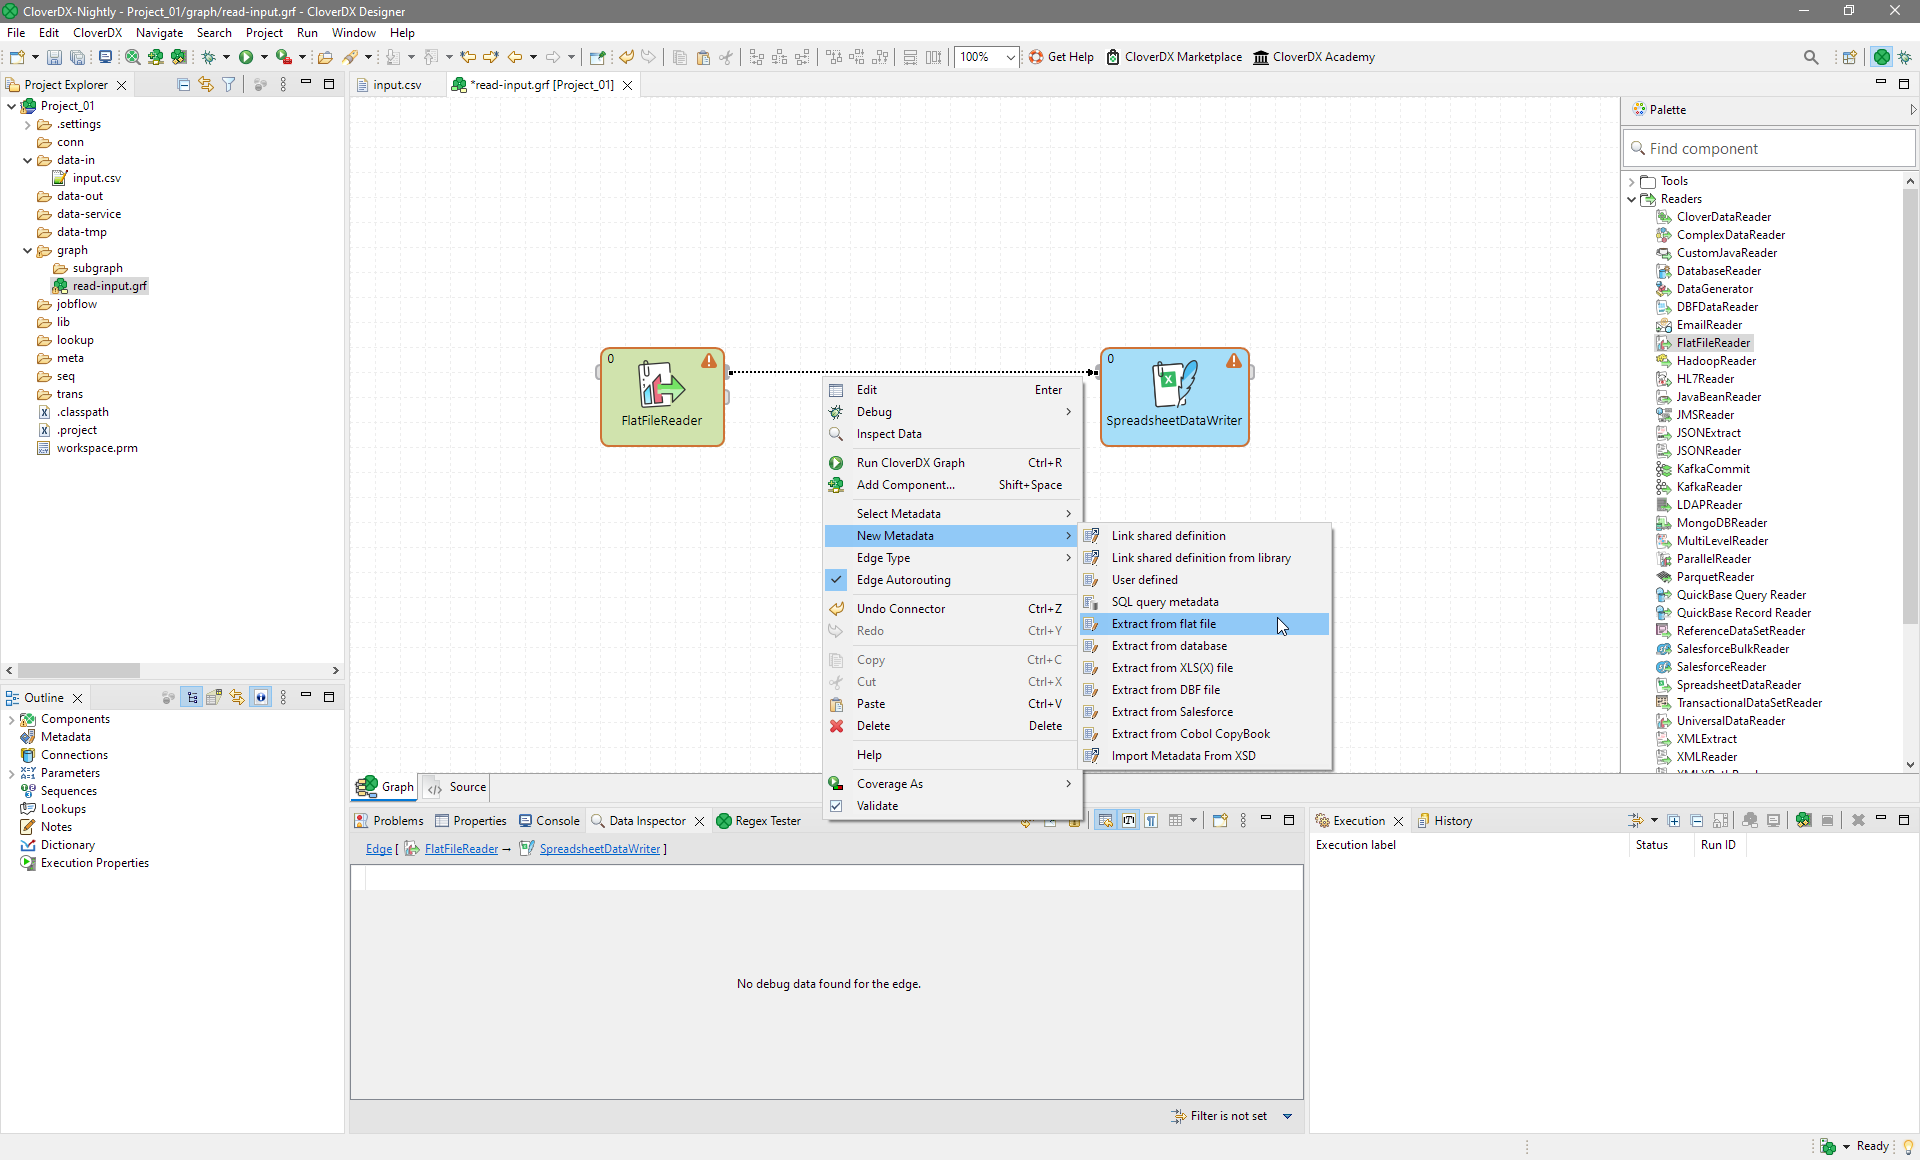
Figure 495. Extracting Metadata
A wizard for metadata extraction opens. Use Browse button to open dialog to specify a file.

Figure 496. Introductory Window of Metadata Editor
Select the input.dat file in data-in directory and click the OK button.
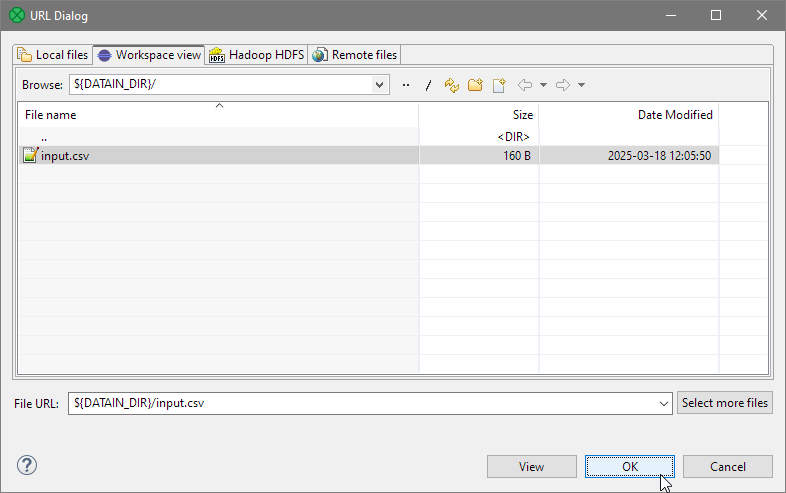
Figure 497. Selecting Data File
The Metadata Editor fills up:
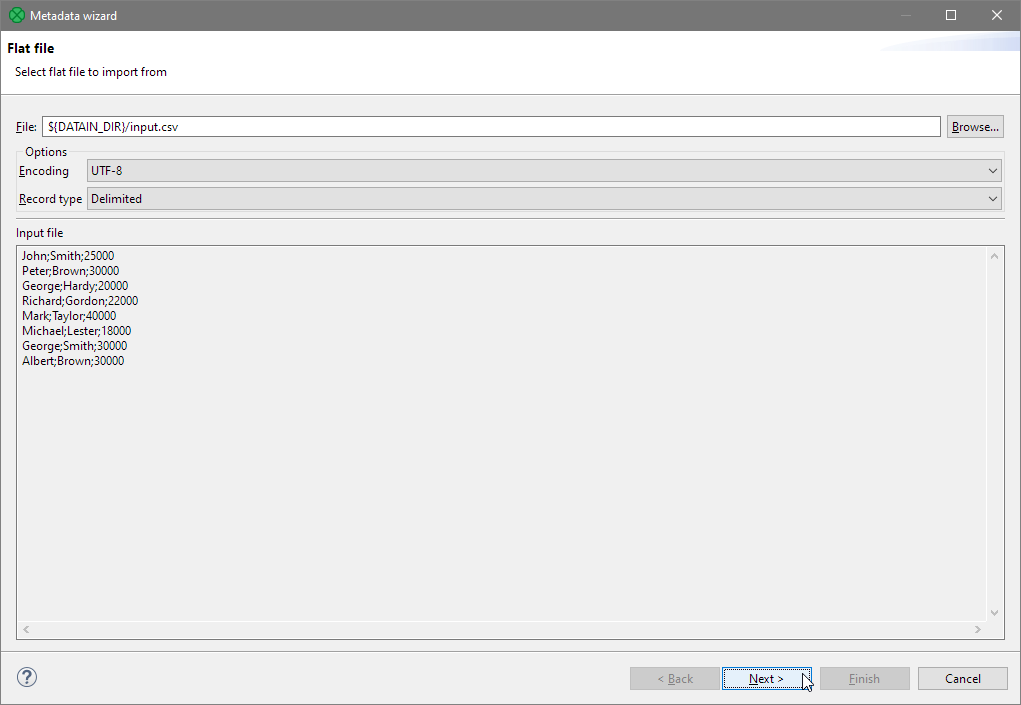
Figure 498. Metadata Editor (Introductory Pane Filled)
Click Next to specify metadata fields.
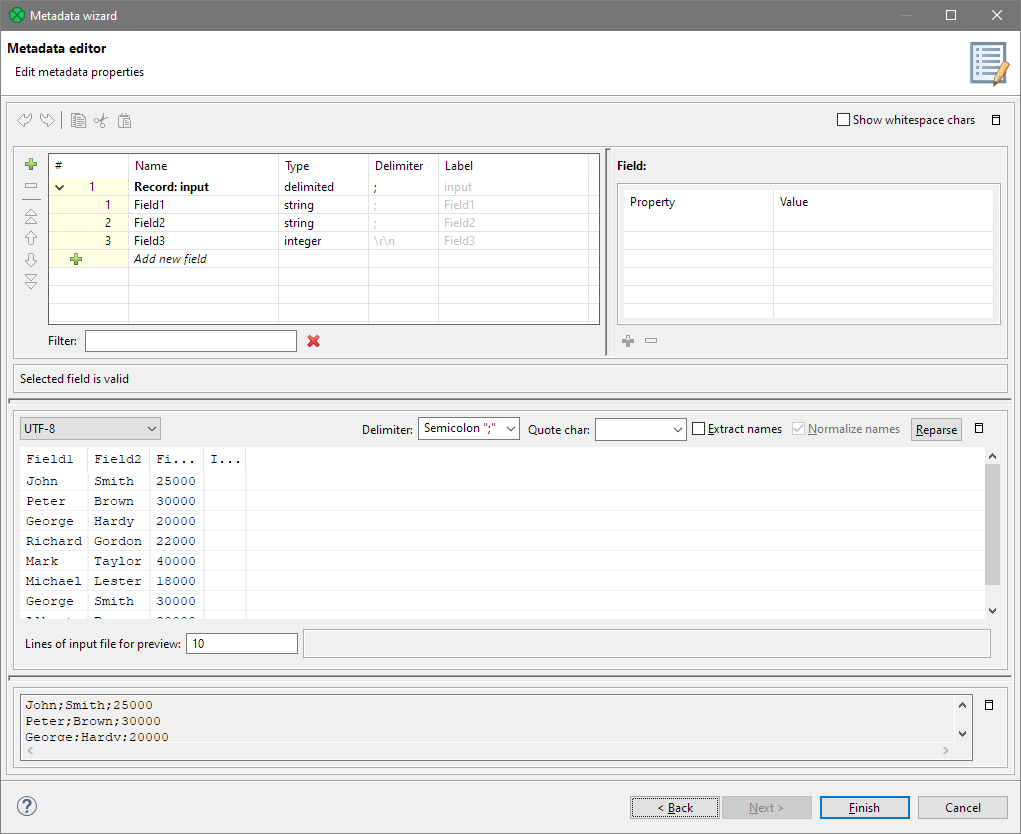
Figure 499. Metadata Editor (Editing Pane)
As you can see, the wizard guessed that the records consisted of three fields and it also understood that the third field values were integer numbers.
You can replace the three default field names (Field1, Field2 and Field3) with more descriptive ones: FirstName, LastName and Salary.
To do that, click the Field1 item and enter the new field name.

Figure 500. Renaming a Field
Do the same with the other two field names. The result will look like this:
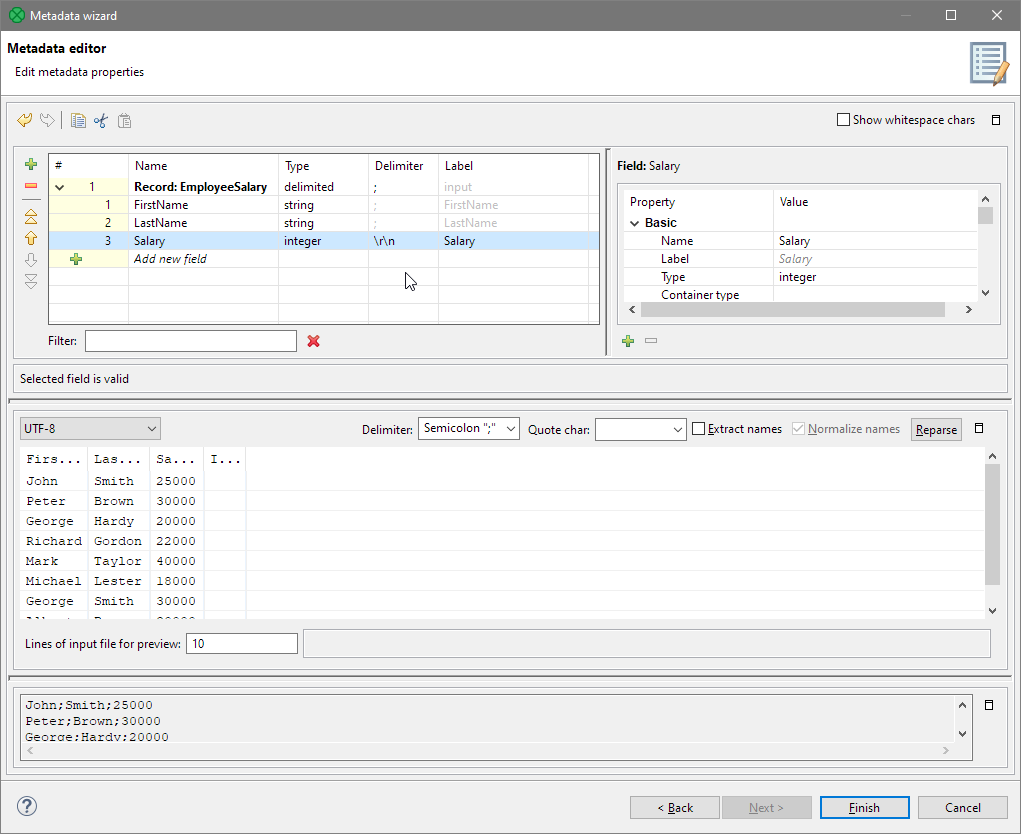
Figure 501. All Fields Have Been Renamed
Now click Finish. This way you have created metadata. The metadata has been assigned to the edge.
|
You can extract metadata on edges and on input components. |
Assigning Metadata to the Edges
If you have metadata assigned to the edge from previous step, you do not have to assign it once more.
If you have any edge without metadata and you would like to assign the metadata to the edge, right-click the edge and select the Select Metadata item from the context menu.

Figure 502. Assigning Metadata to an Edge
Select the desired metadata by clicking its item. The edge with assigned metadata becomes solid.
Setting Up Readers (FlatFileReader)
To set up the FlatFileReader, double-click this component in the Graph Editor pane. The component editor opens.
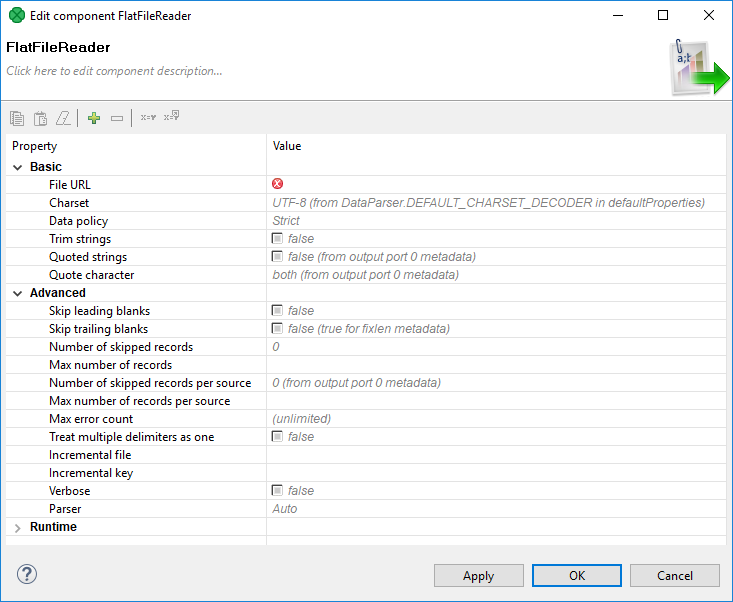
Figure 503. Editing a Reader
Click the File URL attribute row in component editor. A button appears in the row.
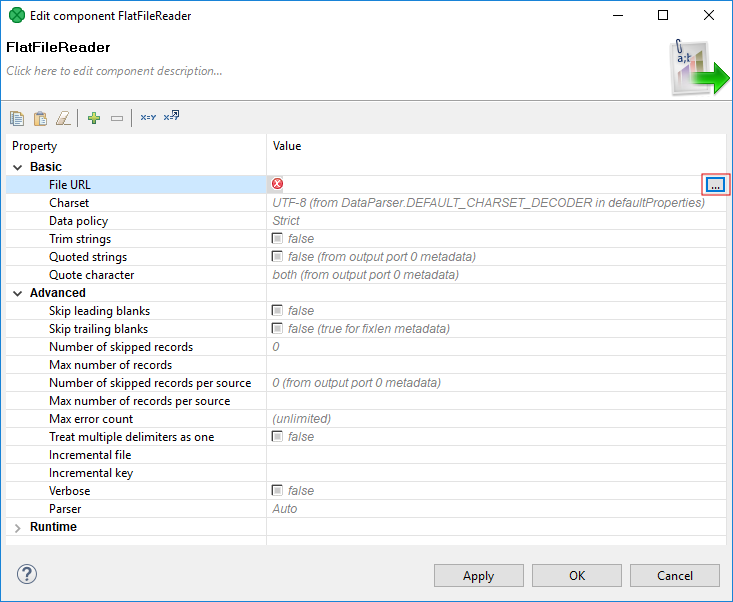
Figure 504. Editing a Reader
Click the tiny button at the of the row to open the File URL dialog.
The input file is in data-in directory.
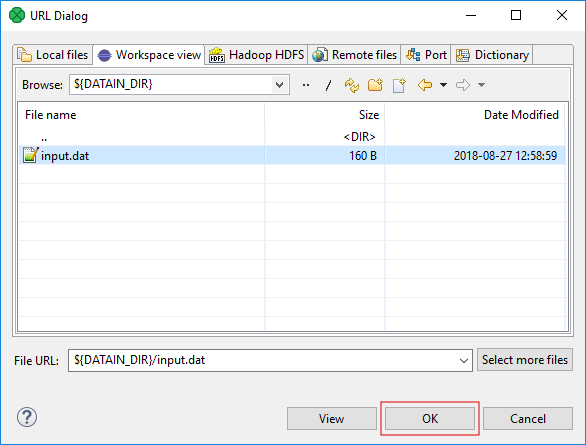
Figure 505. Selecting the file in File URL dialog
Setting Up Writers (SpreadsheetDataWriter)
When you set up writers, the most important is to specify the output files to which data should be written.
Double-click the SpreadsheetDataWriter component. Click the File URL attribute row in the component editor. After that, a button appears in this, click the button.
In the File URL dialog, select the output directory and enter the file name.

Figure 506. Parameters of the Project
Click OK to use the new component configuration.
You have created a (transformation) graph, use Ctrl-S to save it. The graph is ready to be run.
Running the Graph
To run the graph, right-click anywhere inside the Graph Editor pane and select Run CloverDX Graph from the context menu. The graph will run.
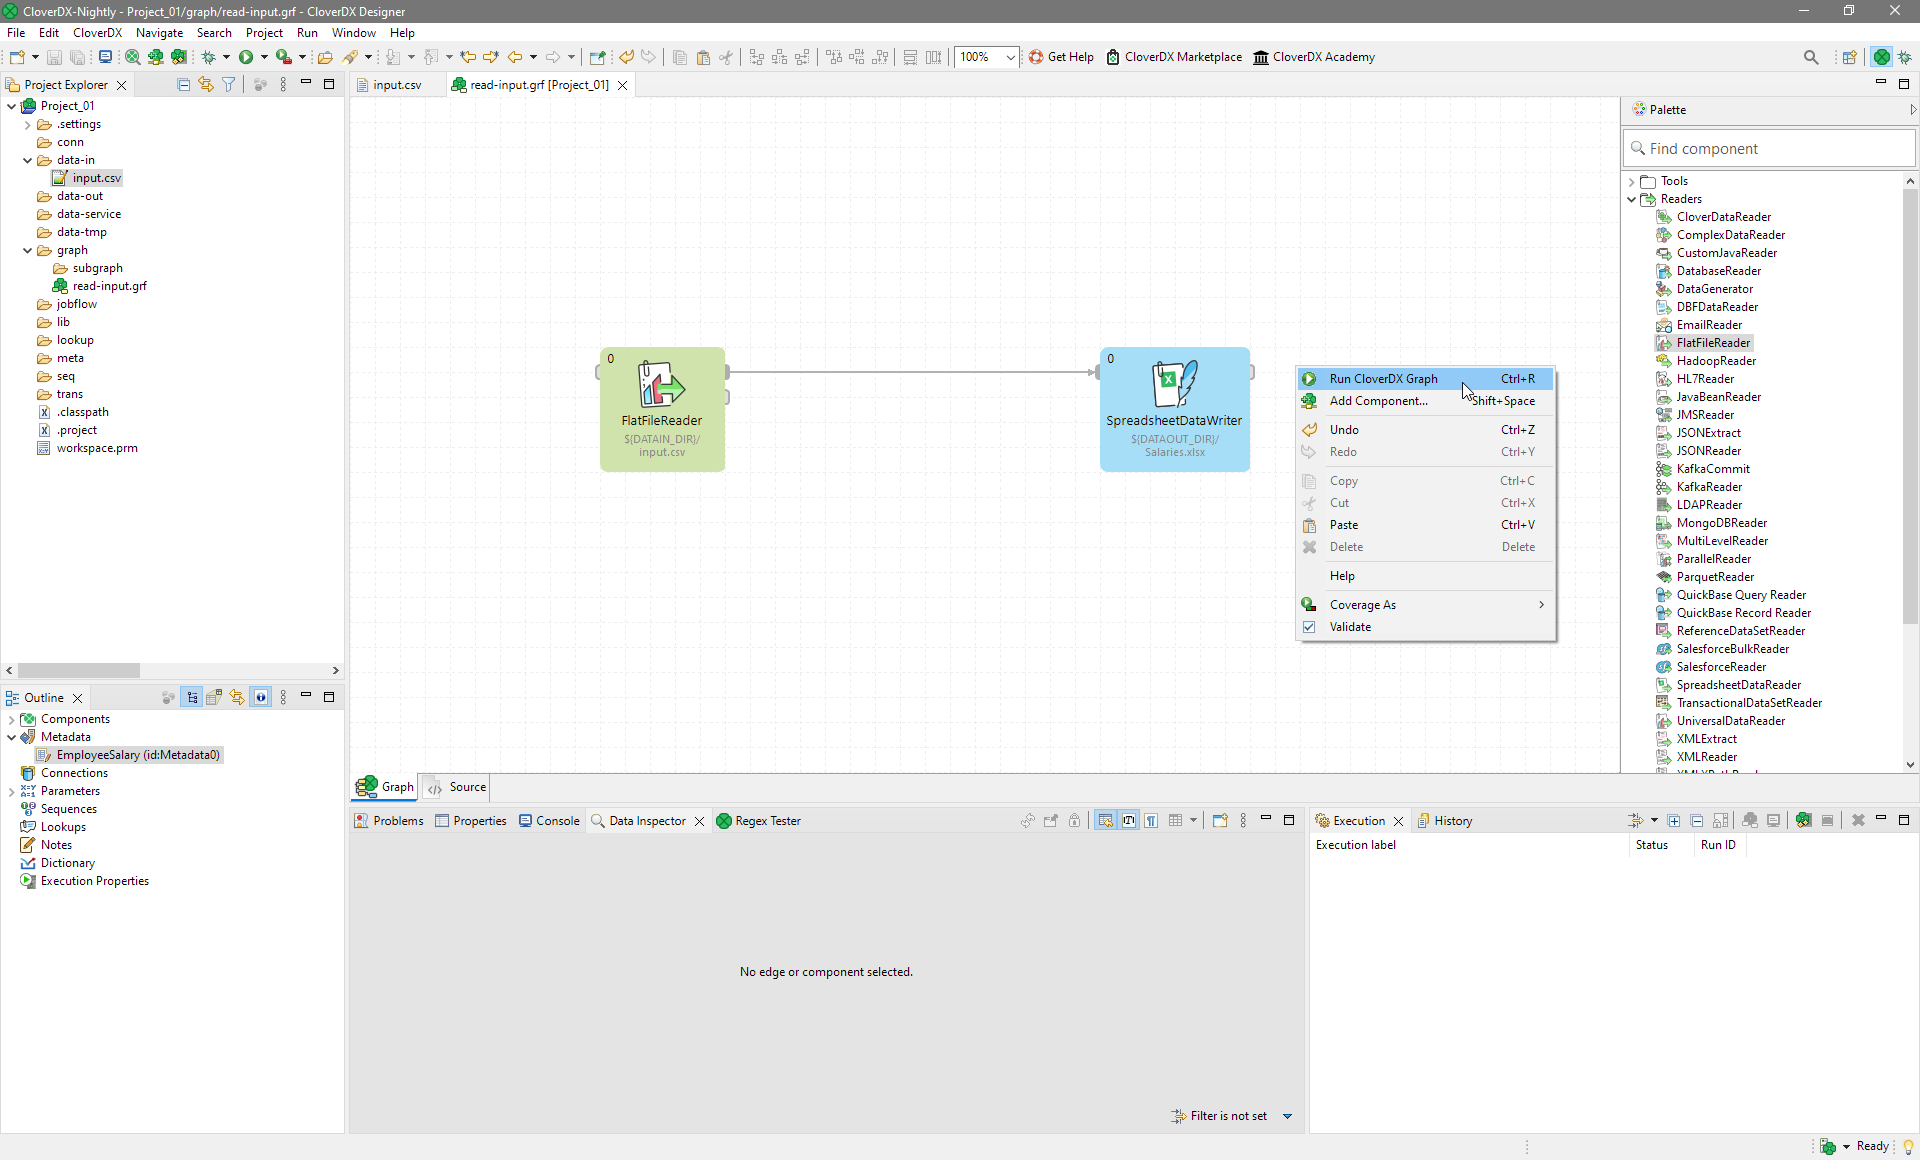
Figure 507. Running the Graph
In the Console tab below the Graph Editor pane, you can see the graph run report. If everything is OK, the graph execution will be successful.
You should see the following window with numbers of parsed records near below the edges:

Figure 508. Execution of Graph Was Successful
If you would like to see more detailed information about graph run, double-click the Console tab. The tab will cover the whole window. You can restore the original size of this tab when you double-click it again.
Opening the Output File
After running a graph, the file structure of the Project Explorer pane refreshes automatically.
Expand the data-out item to see the output.xlsx file.
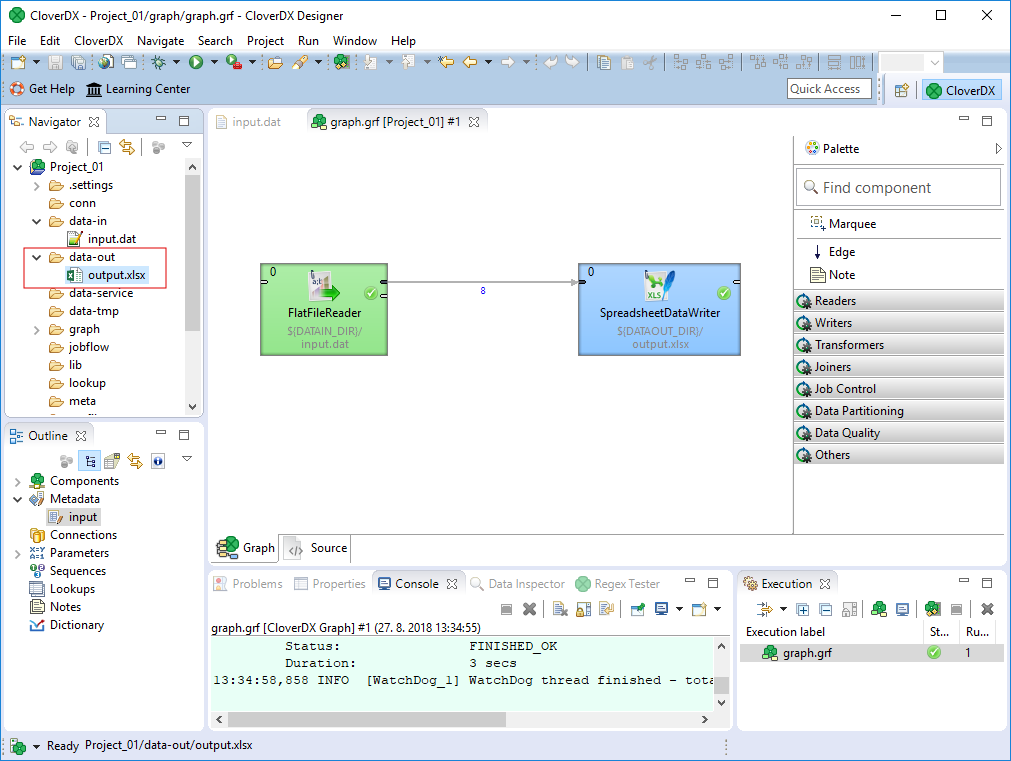
Figure 509. Refreshing the Output Folder
Double click the file to open it with an appropriate spreadsheet editor.
Summary
We have learned to
-
create a transformation graph
-
place component to a graph
-
assign metadata to an edge
-
run a graph
-
read data from a CSV file
-
write data to Excel spreadsheet
What to do next
You can continue with Filtering the records or Sorting the Records.
You can also play with built-in pre-prepared examples: