Debugging Java Transformations
This chapter describes a way to debug an existing Java transformation.
Imagine having a simple transformation graph with three components: Reader, Writer and CustomJavaTransformer. CustomJavaTransformer contains a transformation written in Java and you need to debug it. The debugging is possible in Local and Server projects. Only the way to enable it differs.
Debugging Java Transformations in Local Projects
Open the file with .java source code to place breakpoints.
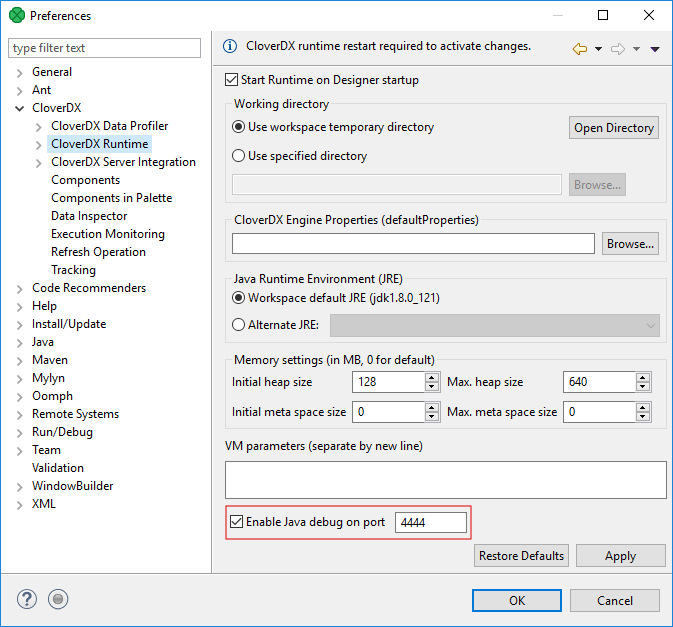
Open Window > Preferences.
In CloverDX > CloverDX Runtime, tick Enable Java debug on port

Click OK. You will be asked to restart CloverDX Runtime. Select Yes to restart it.
Switch back to the graph.
From the main menu, select Run > Debug.
When a breakpoint is reached, you are asked to switch to the Debug perspective.
When the graph debugging finished, you can switch back to the CloverDX perspective.
Debugging Java Transformation in Server Projects
Add -agentlib:jdwp=transport=dt_socket,server=y,suspend=n,address=8085 to Worker’s JVM arguments in Configuration > Setup > Worker.
Make sure that the specified TCP port is not used by any other program.
Restart Worker.
In Designer, open the debug configuration: Run > Debug Configurations…. In the left pane, right click the Remote Java Application item and select New.
Enter host and port (8085).
Click Apply, then click Debug.
Now you can start debugging by running the graph with Run > Debug.
The graph will run and stop on a breakpoint in the same way as in a Local project.
