Chapter 31. Viewing Job Runs - Execution History
| Filtering and ordering |
| Tracking |
| Log File |
Execution History shows the history of all jobs that the Server has executed – transformation graphs, jobflows, and Data Profiler jobs. You can use it to find out why a job failed, see the parameters that were used for a specific run, and much more.
The table shows basic information about the job: Run ID, Node, Job file, Executed by, Status, and time of execution. After clicking on a row in the list, you can see additional details of the respective job, such as associated log files, parameter values, tracking and more.
![[Note]](../figures/note.png) | Note |
|---|---|
Some jobs might not appear in the Execution History list. These are jobs that have disabled persistence for increased performance (for example, some Launch Services disable storing the run information in order to increase service responsiveness). |
Filtering and ordering
Use the Filter panel to filter the view. By default, only parent tasks are shown (Show executions children) – e.g. master nodes in a Cluster and their workers are hidden by default.
Use the up and down arrows in the table header to sort the list. By default, the latest job is listed first.
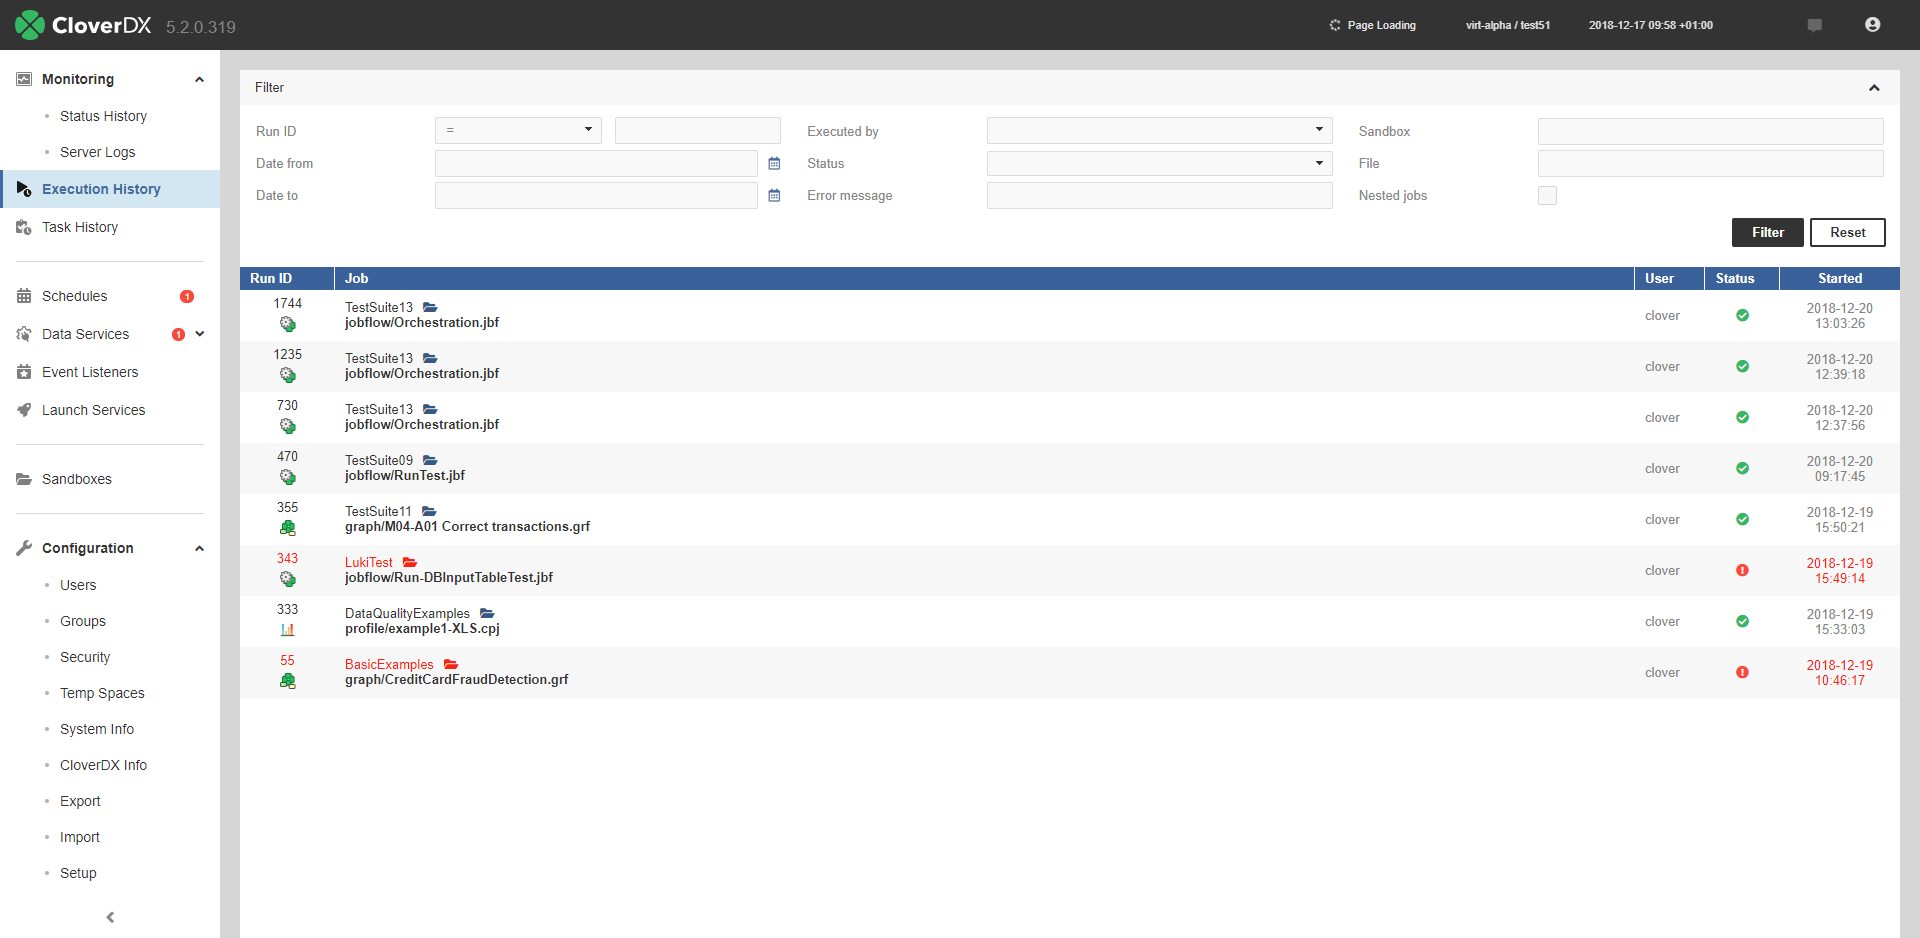 |
Figure 31.1. Execution History - executions table
When some job execution is selected in the table, the detail info is shown on the right side.
Table 31.1. Persistent run record attributes
| Name | Description |
|---|---|
| Run ID | A unique number identifying the run of the job. Server APIs usually return this number as a simple response to the execution request. It is useful as a parameter of subsequent calls for specification of the job execution. |
| Execution type | A type of a job as recognized by the Server. STANDALONE for graph, JOBFLOW for Jobflow, PROFILER_JOB for profiler, MASTER for the main record of partitioned execution in a Cluster, PARTITIONED_WORKER for the worker record of partitioned execution in a Cluster. |
| Parent run ID | A run ID of the parent job. Typically the jobflow which executed this job, or master execution which encapsulates this worker execution. |
| Root run ID | A run ID of the root parent job. Job execution which wasn't executed by another parent job. |
| Execution group | Jobflow components may group sub-jobs using this attribute. See the description of Jobflow components for details. |
| Nested jobs | Indication that this job execution has or has not any child execution. |
| Node | In Cluster mode, it shows the ID of the Cluster node which this execution was running on. |
| Executor | If it runs on Worker, it contains the text "worker". |
| Executed by | The user who executed the job. Either directly using some API/GUI or indirectly using the scheduling or event listeners. |
| Sandbox | The sandbox containing a job file. For jobs which are sent together with an execution request, so the job file doesn't exist on the Server site, it is set to the "default" sandbox. |
| Job file | A path to a job file, relative to the sandbox root. For jobs which are sent together with an execution request, so the job file doesn't exist on the Server site, it is set to generated string. |
| Job version | The revision of the job file. A string generated by CloverDX Designer and stored in the job file. |
| Status | Status of the job execution. READY - waiting for execution start, RUNNING - processing the job, FINISHED OK - the job finished without any error, ABORTED - the job was aborted directly using some API/GUI or by the parent jobflow, ERROR - the job failed, N/A (not available) - the server process died suddenly, so it couldn't properly abort the jobs. After restart, the jobs with unknown status are set as N/A |
| Started | Server date-time (and time zone) of the execution start. |
| Finished | Server date-time (and time zone) of the execution finish. |
| Duration | Execution duration |
| Error in component ID | If the job failed due the error in a component, this field contains the ID of the component. |
| Error in component type | If the job failed due the error in a component, this field contains type of the component. |
| Error message | If the job failed, this field contains the error description. |
| Exception | If the job failed, this field contains error stack trace. |
| Input parameters | A list of input parameters passed to the job. A job file can't be cached, since the parameters are applied during loading from the job file. The job file isn't cached, by default. Note: you can display whitespace characters in parameters' values by checking the Show white space characters option. |
| Input dictionary | A list of dictionary elements passed to the job. A dictionary is used independently of job file caching. |
| Output dictionary | A list of dictionary elements at the moment the job ends. |
For jobs which have some children executions, e.g. partitioned or jobflows also an executions hierarchy tree is shown.
Table 31.2. Icons Used in Hierarchy Tree
| Icon | Description |
|---|---|
 | Indicates a graph job type. |
 | Indicates a subgraph job type. |
 | Indicates a jobflow job type. |
 | Indicates a profiler job type. |
If a job fails, the icon of the respective job changes to indicate the error
( ).
If a child of a job fails, both the child's and parent's icon indicate the error.
).
If a child of a job fails, both the child's and parent's icon indicate the error.
Other icons in the hierarchy tree indicate a job execution type:
 - standalone job,
 - master job executing other jobs, i.e. partition workers,
 - partition worker executed by master job.
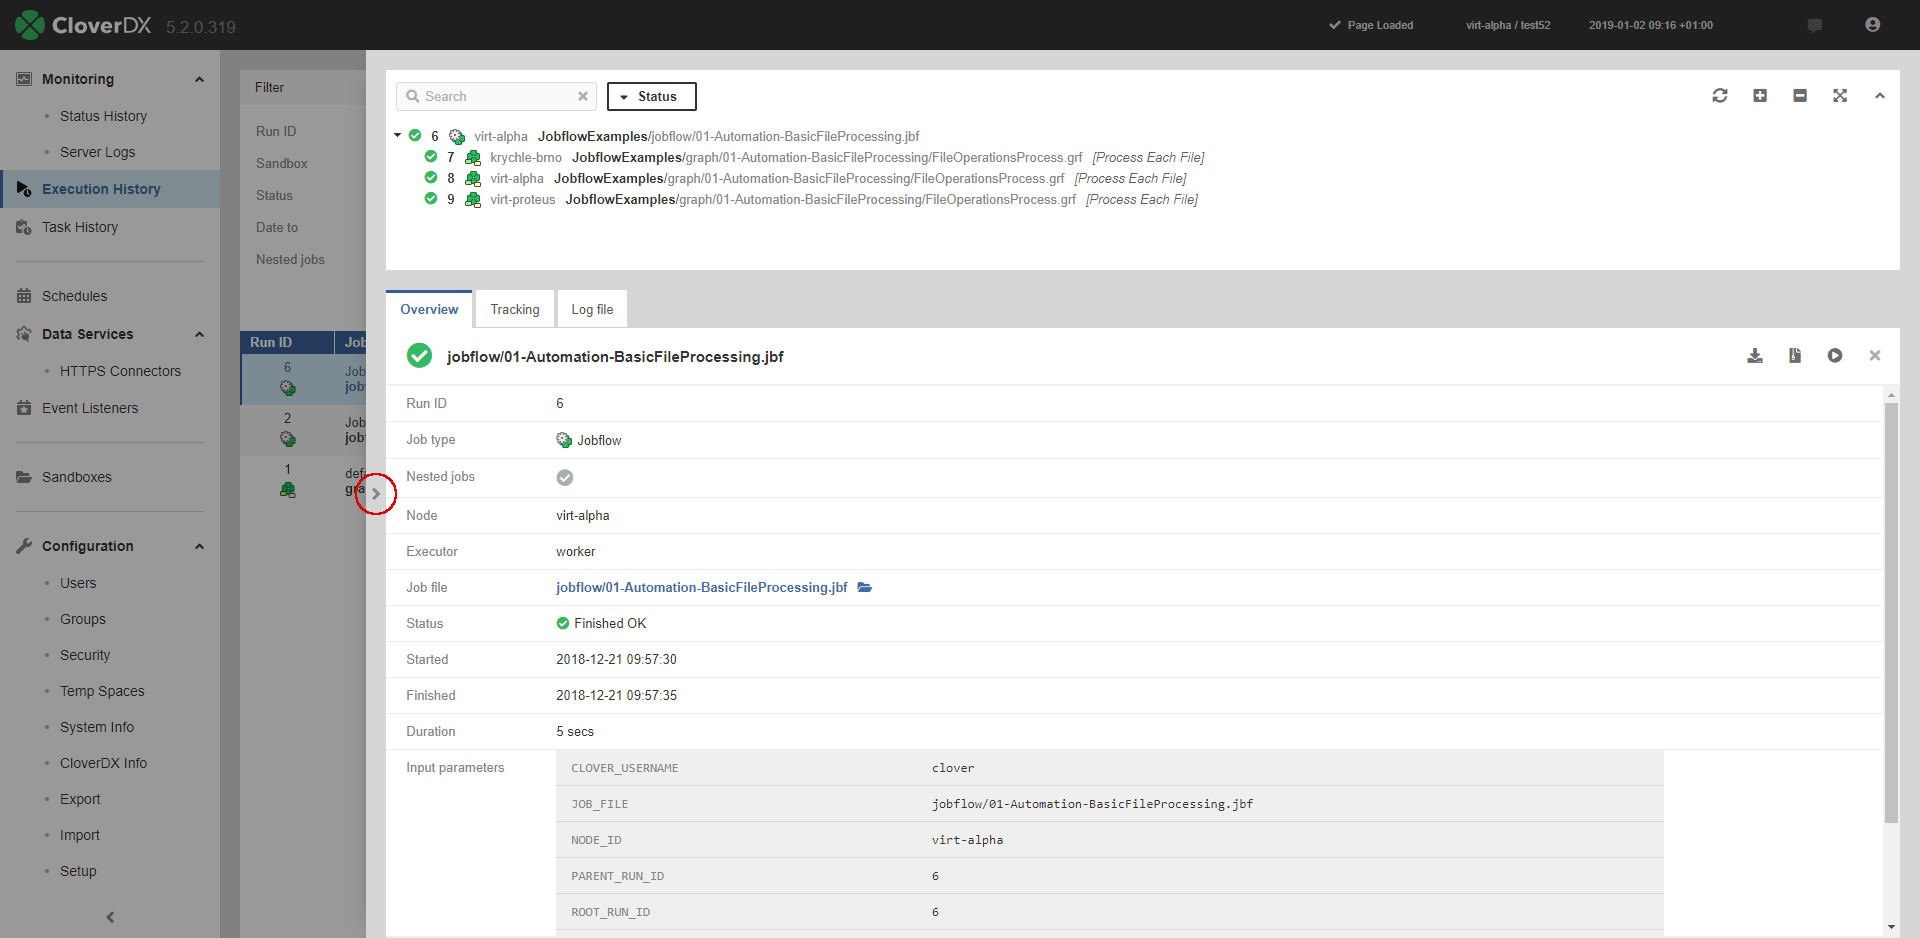 |
Figure 31.2. Execution History - overall perspective
![[Tip]](../figures/tip.png) | Tip |
|---|---|
By clicking the arrow on the left side of the detail pane (see the figure above), you can expand the detail pane for easier analysis of job logs. |
Executions hierarchy may be rather complex, so it's possible to filter the content of the tree by the fulltext filter. However when the filter is used, the selected executions aren't hierarchically structured.
Tracking
The Tracking tab, contains details about the selected job:
Table 31.3. Tracking table information
| Attribute | Description |
|---|---|
| Component ID | The ID of the component. |
| Component name | The name of the component. |
| Status |
Status of data processing in the respective component.
|
| CPU | CPU usage of the component. |
| Port | Component's ports (both input and output) that were used for data transfer. |
| Records | The number of records transferred through the port of the component. |
| kB | Amount of data transferred in kB. |
| Records/s | The number of records processed per second |
| KB/s | Data transfer speed in KB. |
| Records/s peak | The peak value of Records/s. |
| KB/s peak | The peak value of KB/s. |
Figure 31.3. Execution History - Tracking
Log File
In the Log file tab, you can see the log of the job run with detailed information. A log with a green background indicates a successfully run job, while a red background indicates an error.
You can download the log as a plain text file by clicking
or as a zip archive by clicking .
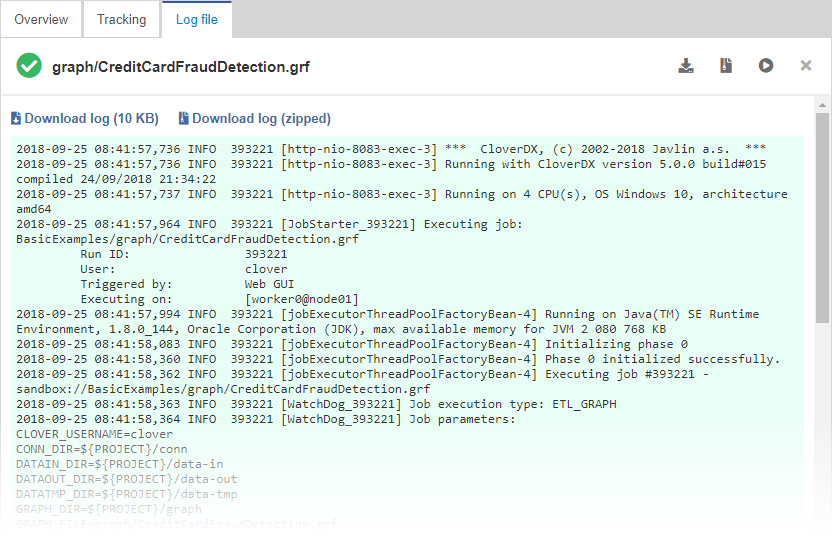 |
Figure 31.4. Execution History - Tracking