Screens hierarchy
Reporting Console consists of several screens. At the top of every screen there is a navigation bar:
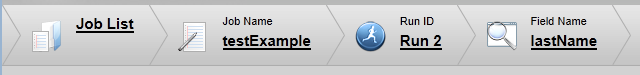
Figure 6.2. Task hierarchy
Clicking individual parts of the bar enables you to quickly switch between:
the list of all jobs (the top of the hierarchy - Job List)
individual jobs with all their runs (there can be more runs per single job - Job View)
individual runs (Run View)
detailed field information (the bottom of the hierarchy - Field View)
Job and run information in these screens can be exported to an XML or directly printed out - notice the Export to XML and Print buttons in the upper right-hand corner.
![[Tip]](../figures/tip.png) | Tip |
|---|---|
When printing results of a profiling run, it can be helpful to print them with landscape orientation. This way results of a larger number of metrics fit on the pages. |
If you export a job, the output file will also contain information about its runs. If you export a run, the file will contain run information plus the results report. On Windows and Linux you will be asked to open or save the downloaded XML report. On Mac OS X, the XML content will be displayed directly in the browser window.
Job List
When working with Job List, you can view and/or sort jobs according to e.g. Last Run Date etc.
You can delete a job by using the trash icon next to its name. Please note performing this operation will cause loss of the job and all its runs.
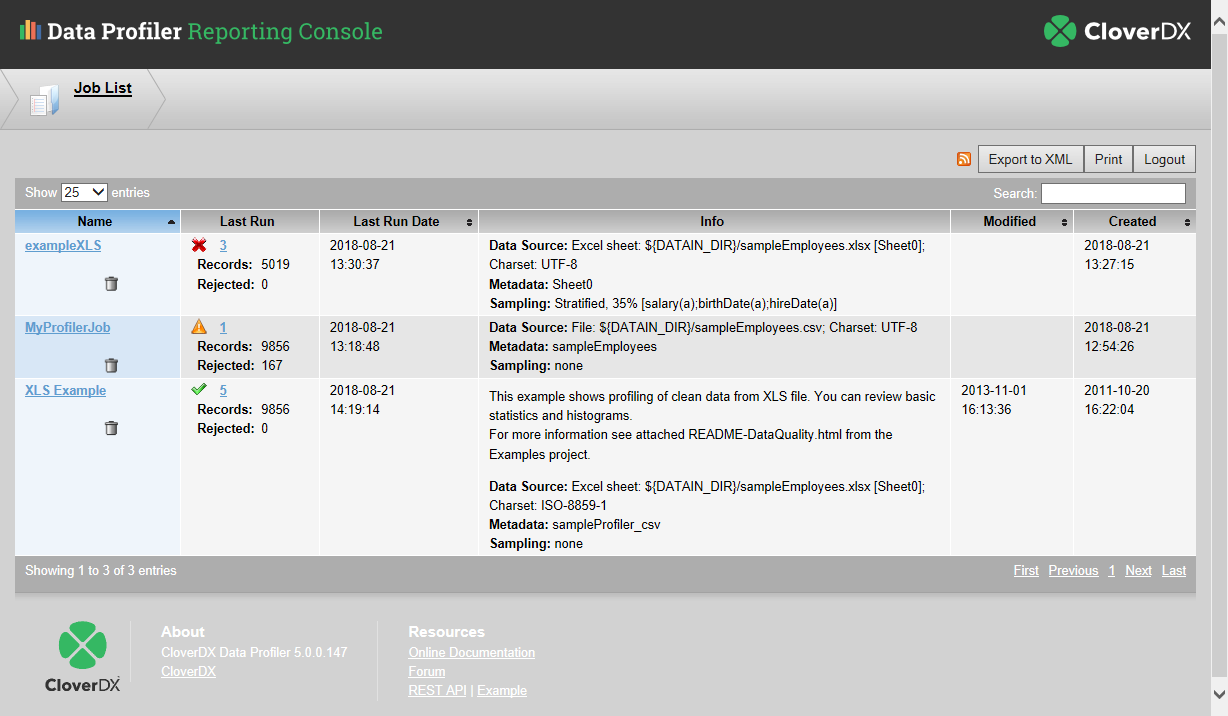 |
Figure 6.3. Job list
Job View
To access the second level of hierarchy - Job View - click a job in Job List.
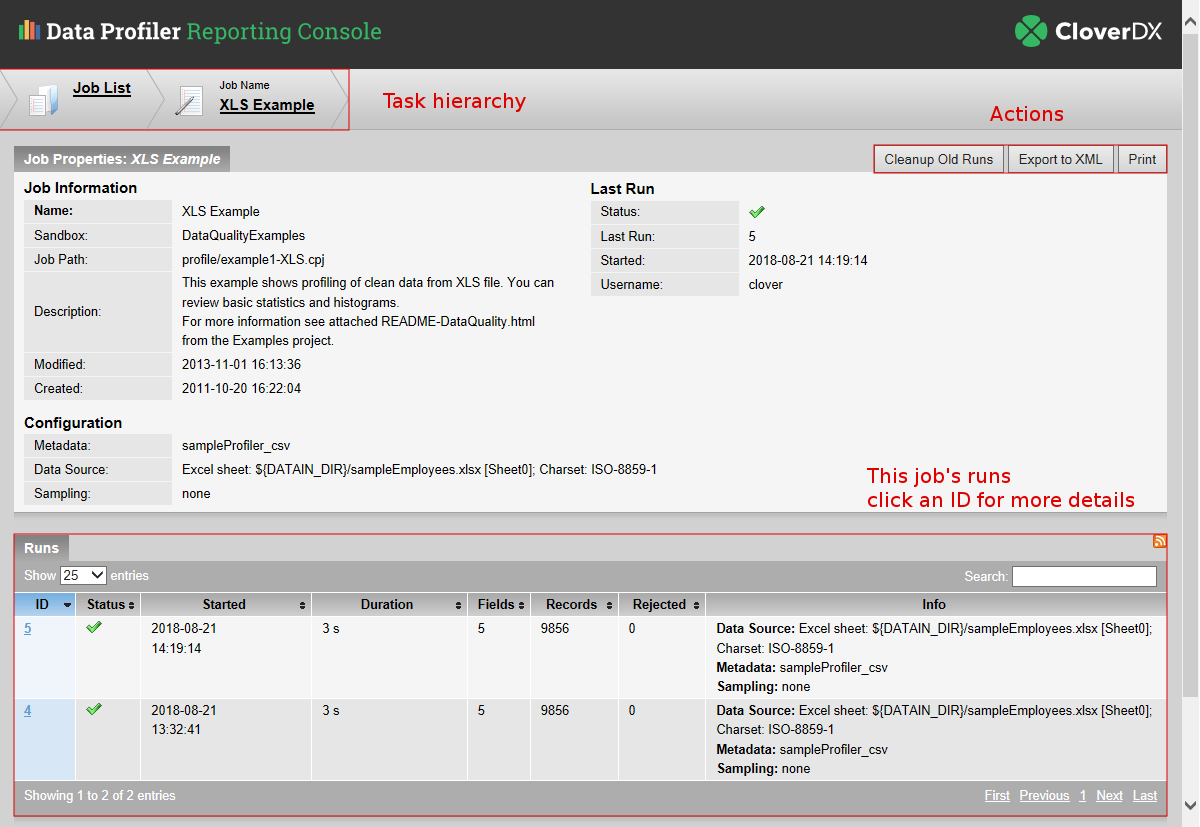 |
Figure 6.4. Job view
In this view, you can observe especially the Configuration the job had. Moreover, there is the Status field informing about results of the run (see the section called “Running Jobs”).
The Cleanup Old Runs button in the upper right hand corner serves to delete runs older than a specified number of days or keep only a given number of runs (see the screenshot below.)
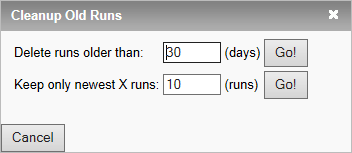
Figure 6.5. Cleanup Old Runs form
Run View
Clicking a run in the Job View's Runs list will get you to the third level of hierarchy: Run View. In the Run View (Figure 6.1, Reporting console - job results), you can observe how many fields your run had or how many records were processed. Above all, you can see the Fields table with all fields and metrics you have demanded.
You can sort the table by clicking a column heading (e.g. ID, Minimum Value, Median). If you click again, you will cycle between the ascending and descending order.
A useful feature is the Search field which searches the table for the text you type in real time. Type e.g. "order" to instantly filter the table to show only the "OrderDate" and "OrderID" fields and their metrics.
Field View
Notice field names in Job List appear as links there. You can click them to bring a new window that shows the field in detail - Field View.
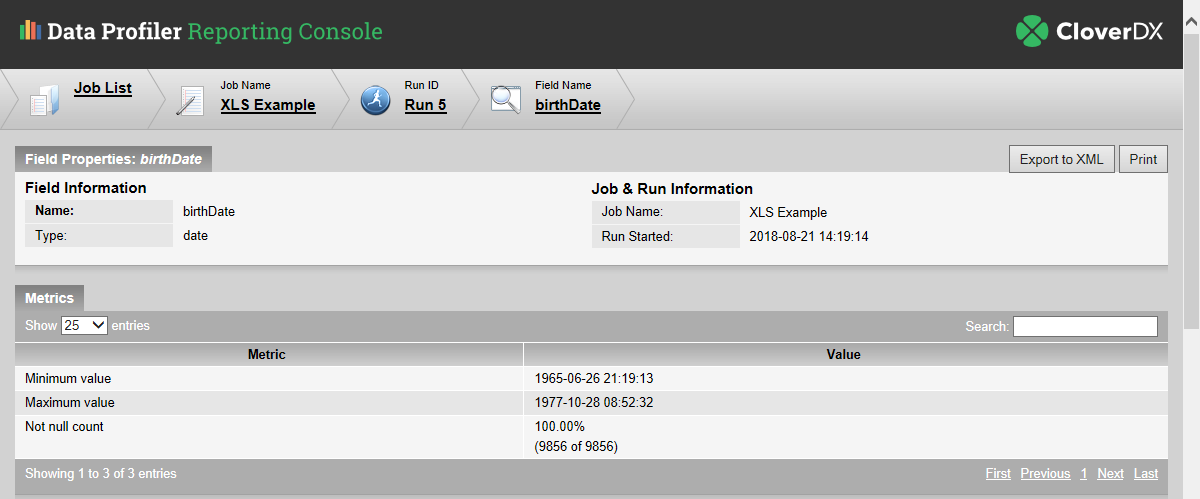 |
Figure 6.6. Field View
Here you can observe various field details, precise metrics values and charts.
Charts are also shown in this view - Interval chart, Frequency chart or Time unit chart. They will only be visible if you checked any of the chart metrics for that field during the job creation/editing. See the picture below.
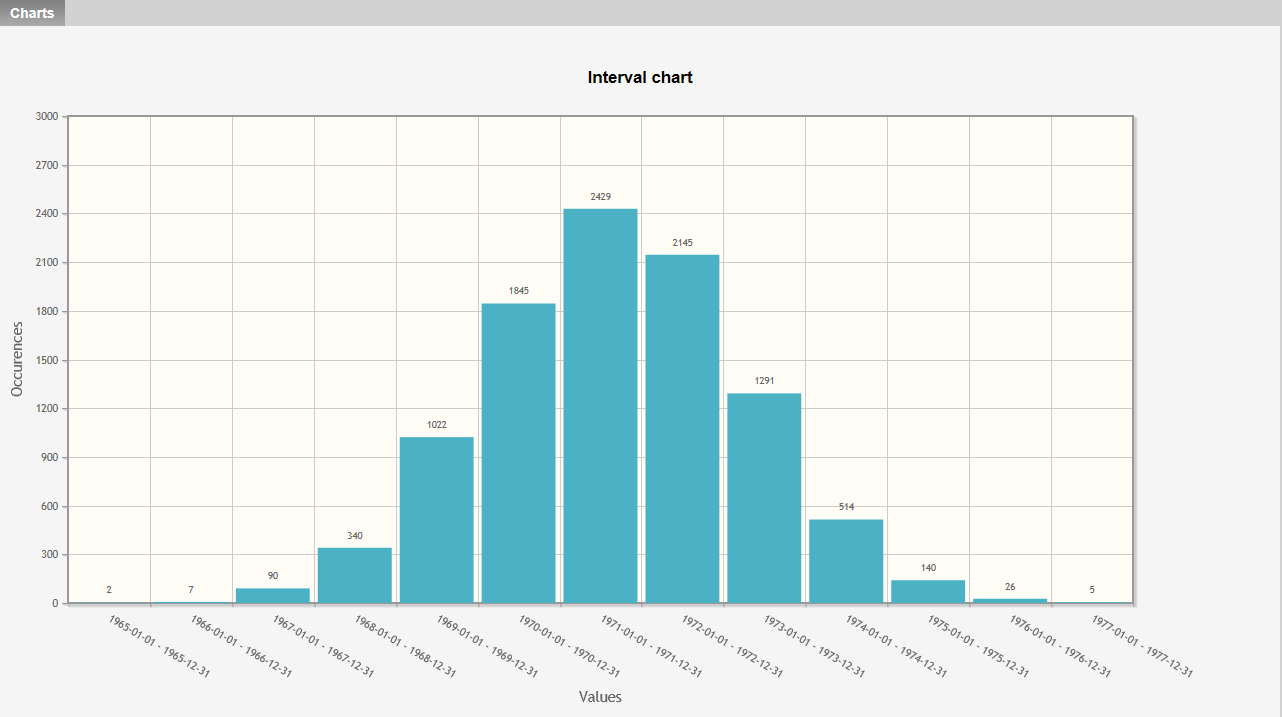 |
Figure 6.7. Chart
Note: Metrics with date and time result type will only be displayed with precision up to seconds. Milliseconds are trimmed off in the results database.