Chapter 67. CTL Debugging
CloverDX lets you debug CTL code in the same way as development tools do it for other programming languages.
Debugging is useful if you have a complex transformation and you would like to step the transformation to see the values of variables.
To debug the transformation, add breakpoints and launch the transformation in the debug mode. Breakpoints can be added in Transform Editor on the source code tab.
Adding Breakpoint
Open the Transform Editor.
Switch to the source tab.
In the source tab, right click the line number and choose Toggle Breakpoint from the context menu.
Types of breakpoints
Breakpoints can be internal or external (in external .ctl file).
By default, the execution stops each time a breakpoint is hit.
With Hit count, the execution stop each n-th hit of the breakpoint.
With a Conditional breakpoint, the execution stops only if a condition is true, e.g. the value of a variable equals to 10, or if the value of a variable changes.
Debugging
Run the graph from the main menu: → .
When the first breakpoint is reached, you are asked to confirm switching to the Debug Perspective.
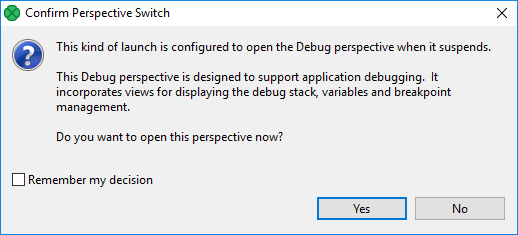
In the Debug Perspective, you can step the program and enable or disable the breakpoints.
![[Note]](../figures/note.png) | Note |
|---|---|
To use the breakpoint, you should run the graph using → . If you run the graph from the context menu, the breakpoint will not be reached. |
Debugging Transformation in Multiple Components
To debug in multiple components, place breakpoints to these components and run the graph in debug mode. The components run in parallel, the graph run stops when the first breakpoint is reached.
Compatibility
The CTL Debugging is available since CloverETL 4.3.0-M1.
See also
Java Debugging is described in Tutorial > Debugging the Java Transformation.