Debugging Edges
| Selecting Debug Data |
| Viewing Debug Data |
| Turning Off Debug |
Debugging edges means recording of data flowing through the edge for further inspection.
Debugging is useful if you obtain incorrect or unexpected results after running a graph, as it helps you locate and identify the errors in the graph.
![[Tip]](../figures/tip.png) | Tip |
|---|---|
If you process a large amount of data, consider limiting the number of records to be saved into debug files or to filter the data. |
By default, debugging is enabled on all edges.
There are several debugging options for each edge. Right-click on the edge and select the Debug option from the context menu:
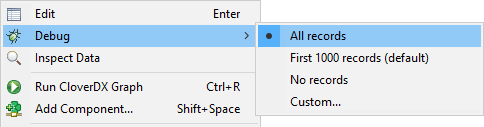
Figure 31.2. Debugging options
Debugging options
- All records
All records going through a debugged edge are saved. When selected, the option is indicated by the icon
 on the selected edge.
- First 1000 records (default)
First 1000 records going through the debugged edge are saved, the rest is ignored. When selected, the debug file size is limited to 1 MB.
- No records
Debugging on the selected edge is disabled. When selected, the option is indicated by the icon
 on the selected edge.
- Custom...
Allows you to set several edge attributes, see Selecting Debug Data. When selected, the option is indicated by the icon
on the selected edge.
After you run the graph, one debug file is created for each debugged edge.
You can analyze the data records from the debug files (.dbg extension),
see Viewing Debug Data.
Debugging on edges can be disabled, see Turning Off Debug.
![[Note]](../figures/note.png) | Note |
|---|---|
You can only view data on some components and on edges with debugging enabled. |
| Note |
|---|---|
The Filter expression option may not be available if multiple edges with different metadata are selected simultaneously. |