Metrics
The major goal when creating a job (see the section called “Creating Jobs”) is to select metrics that will be calculated for each metadata field.
First select a field on the left hand side and second check metrics on the right hand side. Some metrics are selected by default.
The range of available metrics differs for each field and depends on Field Type. Thus, you can analyze e.g. the average value or median for integers while in strings, you can measure the shortest string, non-ASCII records and so forth.
In addition, you can work with more fields at a time by selecting them (Ctrl+click, Shift+click) and assigning metrics to the whole group.
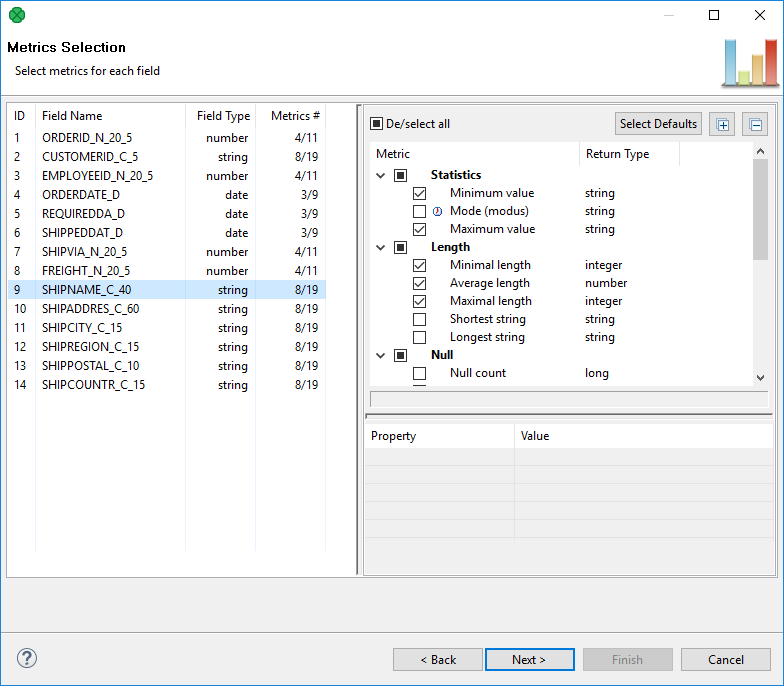
Figure 5.14. Selecting and configuring metrics
Some metrics just need to be checked while some others require additional settings.
If a metric is checked and can actually be configured, you will notice the Property | Value area in the bottom right hand corner becomes active. An example of one such metric is Time unit chart, see the following picture.
Additionally, some metrics return map or list data types when used from within the ProfilerProbe component. Such metrics have their return type marked with an icon, see Most frequent patterns and Non printable ASCII in the picture above.
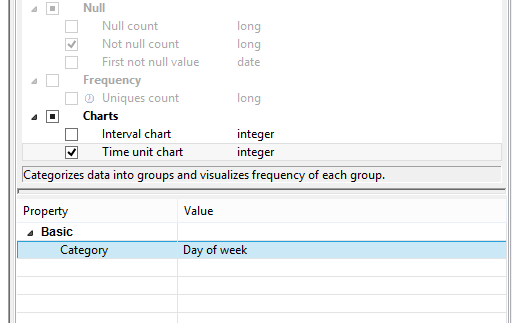
Figure 5.15. Metric configuration. Note the metric has to be checked.
The complete list of metrics you can choose from can be found in Appendix A, List of Metrics.