Running Jobs
Running jobs is a core activity in CloverDX Data Profiler that actually 'creates profiles of your data', i.e. shows results (called runs) of the data analysis. You run jobs single time to learn about an unknown data set. Other jobs are run on a regular basis to maintain data quality, i.e. to monitor how the data changes through time (e.g. by DB updates, modifying source files, etc.).
Remember new jobs you create are automatically run unless you uncheck the Run this job field on the Summary screen. See Creating Jobs.
To run a job, double-click it in Workspace and then click Run job icon in the upper right hand corner of the job tab.
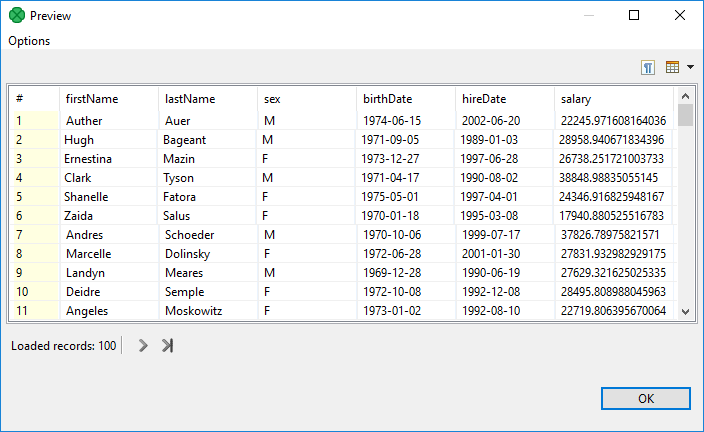
Before running a job, remember you can click Preview Data in the upper right area of the job tab. This will show how the input data has been parsed with the job’s metadata - see example figure below:

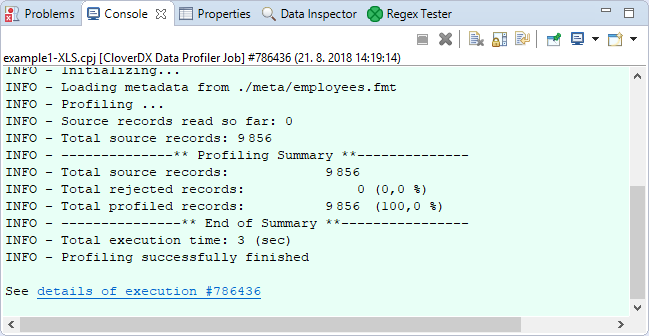
The job execution is accompanied by opening the Console. It automatically pops-up to show relevant information about the currently running job. Among all the obvious messages, pay attention e.g. to Input files. If you used wildcards to specify a set of input files, this message will list all file names being processed.

When the analysis is over, you will get the Reporting Console showing overall statistics of the last run performed. Most importantly, a table of all fields and their metrics will be generated at the bottom (note it may take a few seconds to load). See Reporting Console.
A job that you run ends up in one out of five possible states. They are listed below and can also be seen in the Status field of Reporting Console.
| Icon | Status | Description |
|---|---|---|
|
|
Profiling was successful. |
|
|
Profiling was successful, but some records were not analyzed due to errors. |
|
|
Profiling was not completed and a severe error occurred. |
|
|
Profiling is currently running. |
|
|
Profiling was either terminated by the user or could not be completed for reasons unknown (e.g. a program crash, HW errors). |


