Standalone Server Detail
Standalone Server detail view displays info collected from the standalone Server. The info is grouped in several panels. The following panels are displayed by default.
You can display the hidden actions with Actions button: choose → .
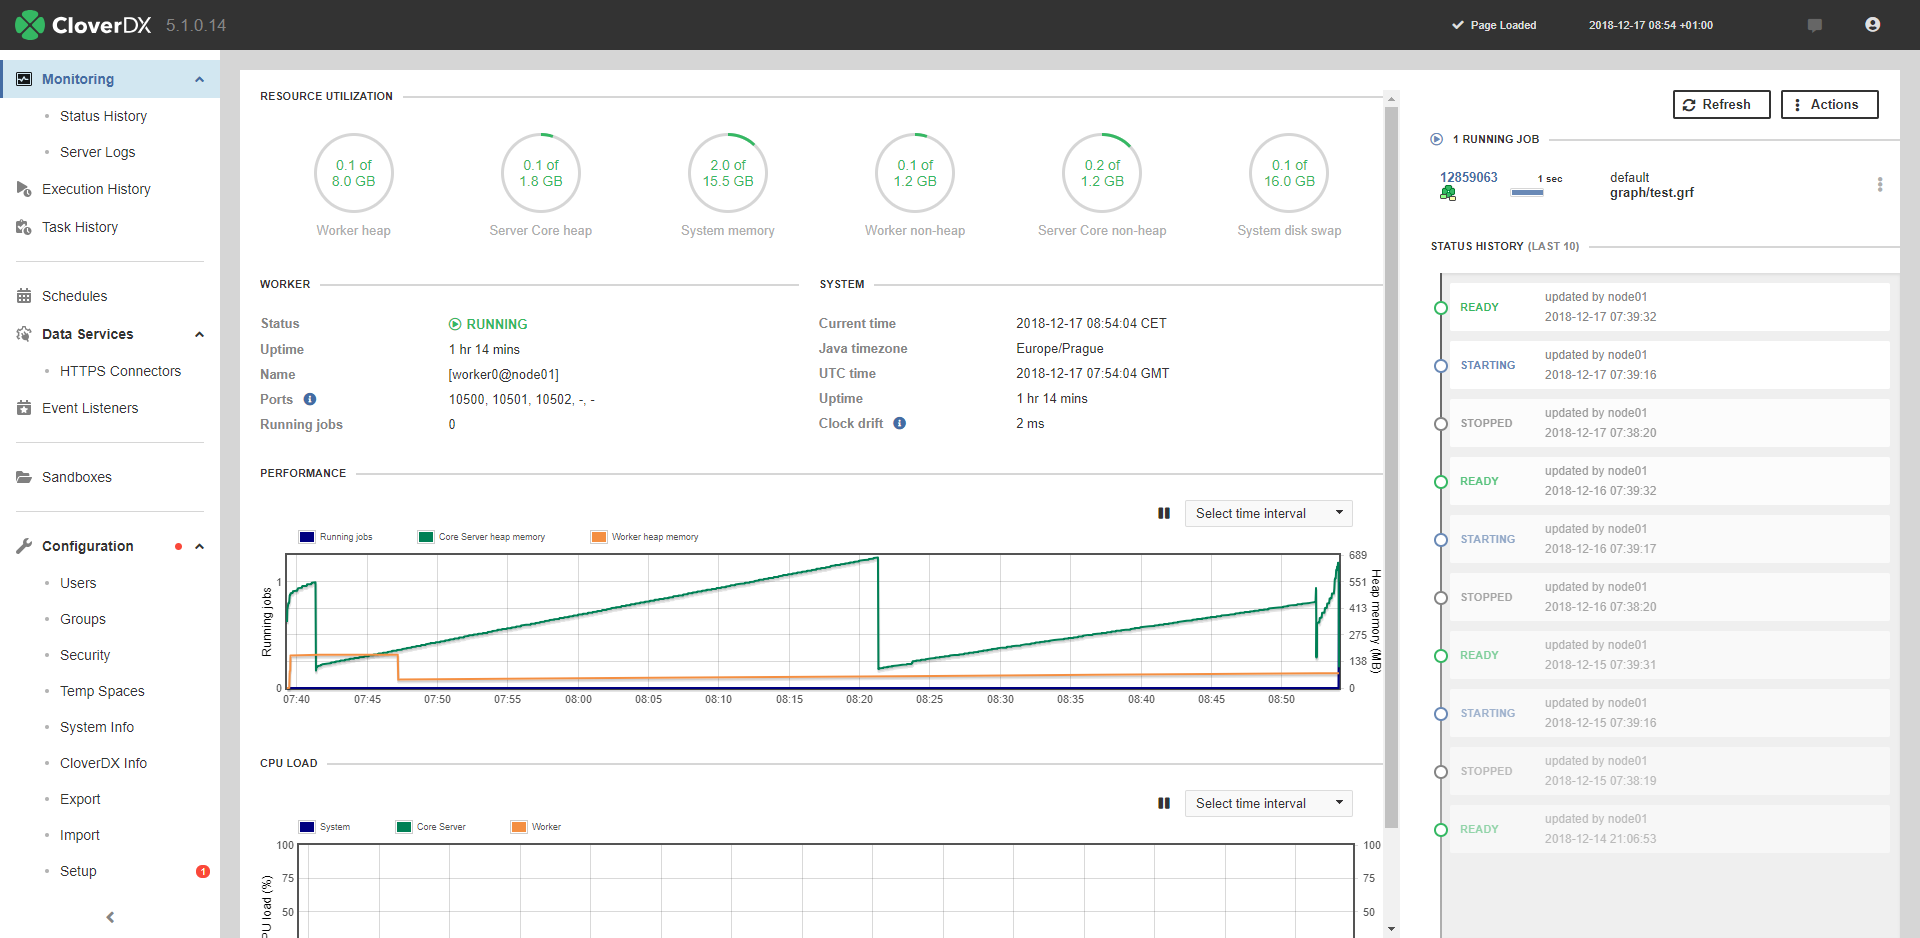 |
Figure 18.1. Standalone server detail
Resource Utilization
Resource Utilization panel shows the amount of used System memory, System disk swap Server Core heap memory, Server Core non-heap memory, Worker heap memory and Worker non-heap memory.
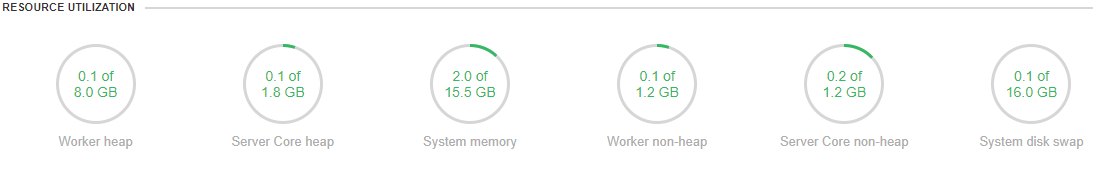
Figure 18.2. Resource Utilization
Worker and System
Contain basic information about Worker and operating system.
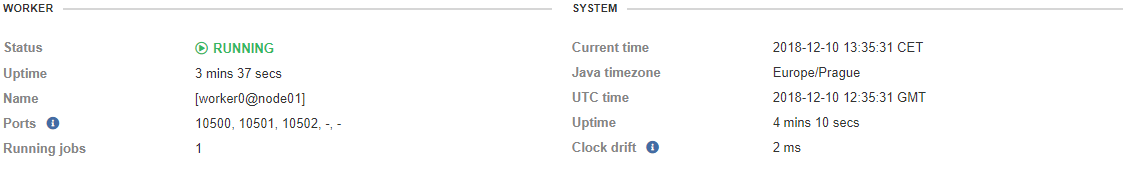
Figure 18.3. Worker
License
Contains information about license.
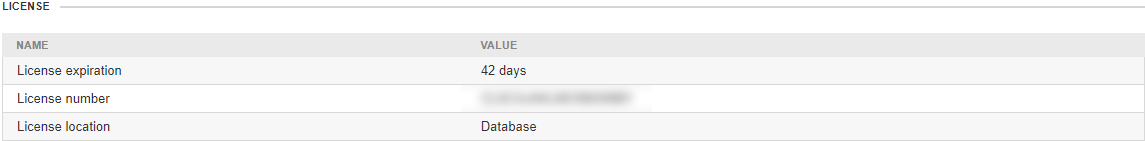
Figure 18.4. System
Performance
The Performance panel contains a chart with three basic performance statistics:
a number of running jobs, amount of used up Server and Worker heap memory.
The graph displays values gathered within a specific interval.
The interval can be set up with the combo box above the graph
or configured by the cluster.node.sendinfo.history.interval config property.
Note that the heap memory is constantly oscillating, even in idle state, since it is periodically managed by JVM garbage collector (i.e. the temporary data required for running CloverDX Server and Worker is periodically removed from/allocated to the heap memory).
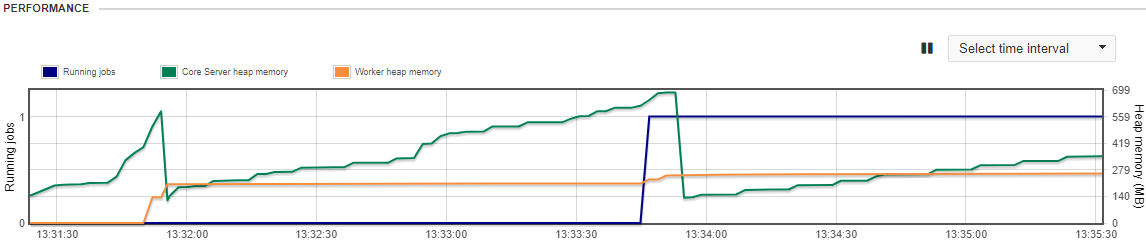
Figure 18.5. Performance
CPU Load
The CPU Load panel displays a chart with info about total CPU load and CPU load caused by JVM (both Core Server and Worker).
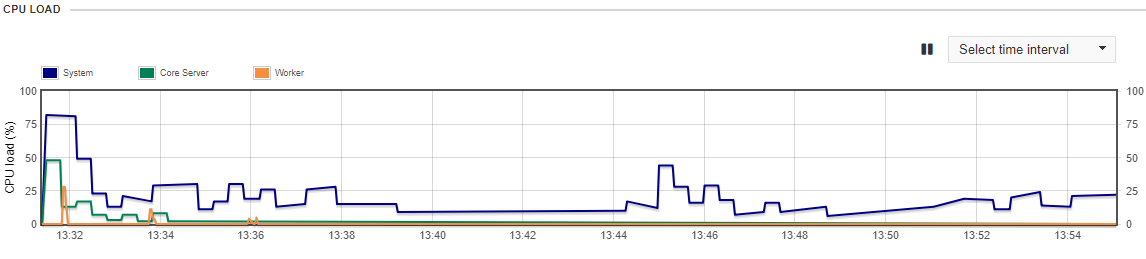
Figure 18.6. CPU Load
Running Jobs
Running jobs panel lists currently running jobs, 10 most recent runs are displayed.
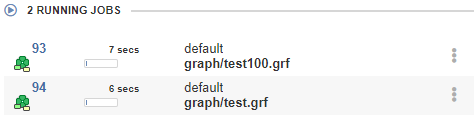
Figure 18.7. Running jobs
Status History
Status history panel displays node statuses history since restart of the Server.
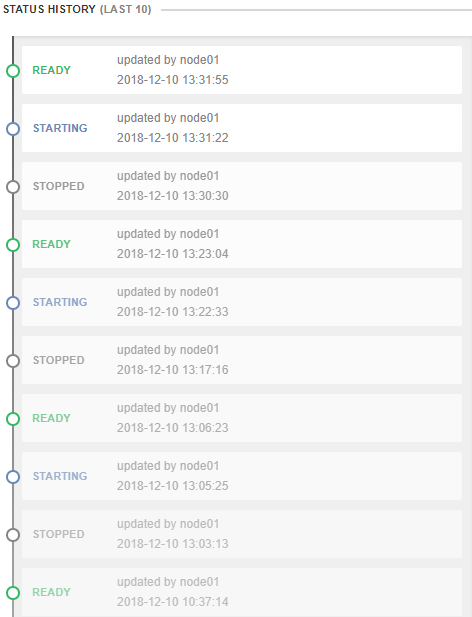
Figure 18.8. Status History
Users' Accesses
This panel lists info about activities on files performed by users. The list displays a timestamp of an event, username, address and name of the method.
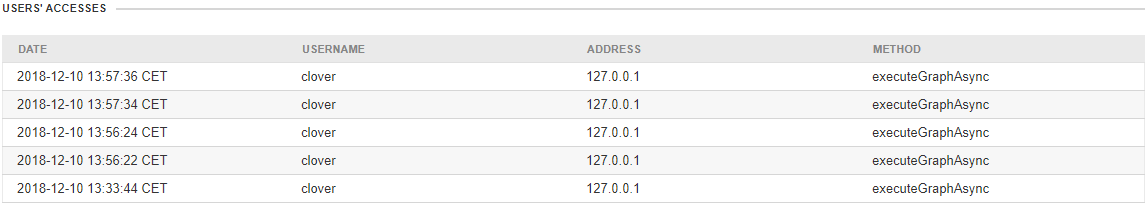
Figure 18.9. Users' Accesses panel
Classloader cache
Classloader cache lists all currently cached classloaders. The classloader cache may be empty as classloader caching is disabled by default.
Status
Status panel displays current node status since last server restart. It displays current server status, exact Java version, exact CloverDX Server version, way of access to database, etc.
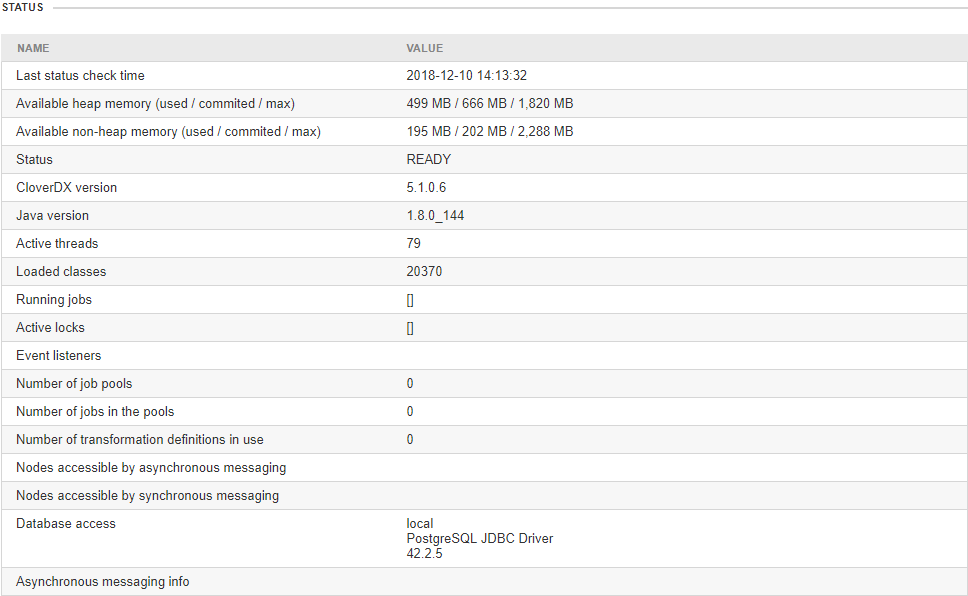
Figure 18.10. Status
Resource Utilization Detail
Provides information about CloverDX Server utilization of operating system resources.
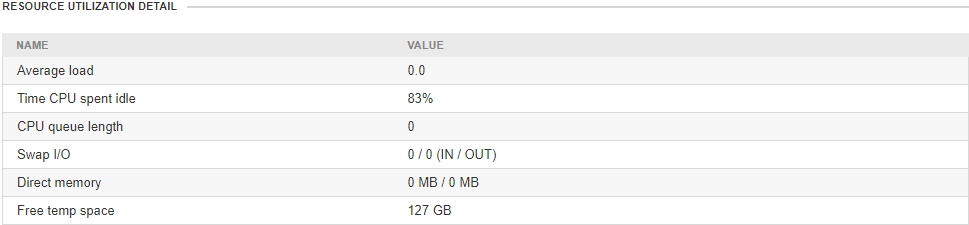
Figure 18.11. Status
Heartbeat
Heartbeat panel displays a list of heartbeat events and their results.
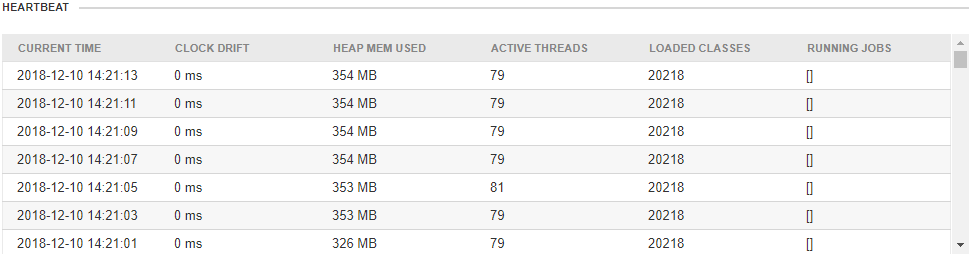
Figure 18.12. Heartbeat
Threads
Threads panel lists Java threads and their states.
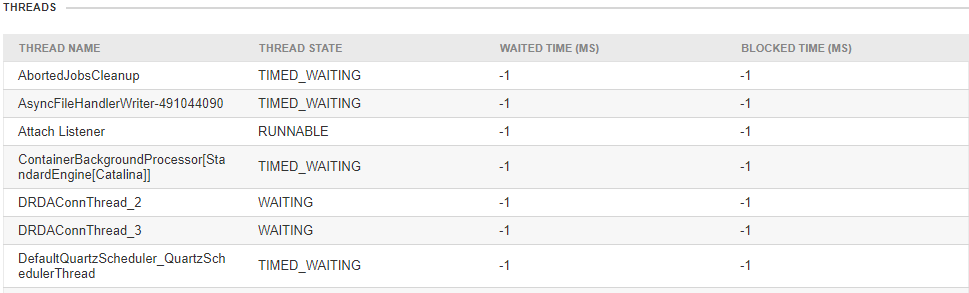
Figure 18.13. Threads
Quartz
Quartz panel lists scheduled actions: their name, description, start time, end time, time of previous event, time of next event and expected final event.
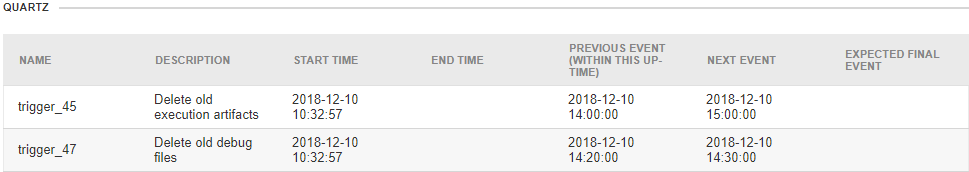
Figure 18.14. Quartz