Chapter 39. Job Inspector
Overview
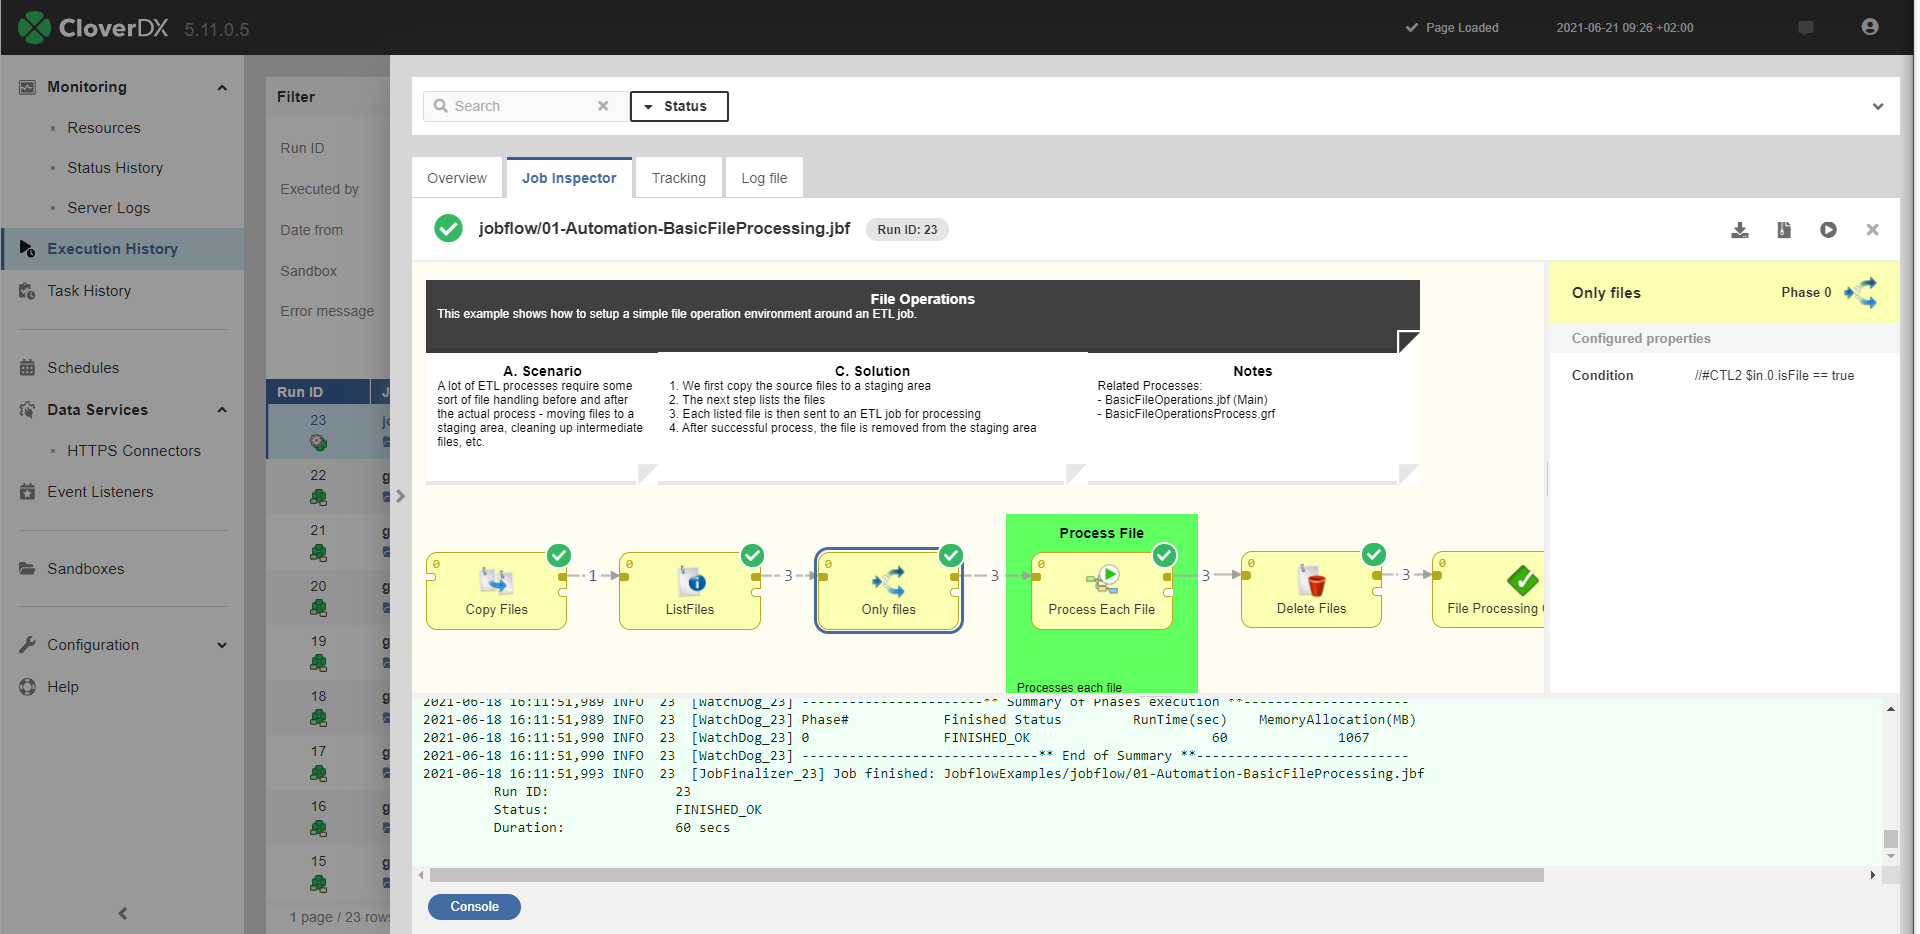 |
Figure 39.1. Job Inspector in Execution History
The Job Inspector is a graphical tool, allowing authenticated users to view, track progress or investigate past executions from CloverDX Server console. It is designed to help DataOps and DevOps team operate more efficiently in production environments, where using CloverDX Designer may be undesirable or impossible.
Job Inspector aims to provide tools necessary to check for configuration and data issues, helping support personnel to better understand processes and thus allowing them to create more accurate error reports for development teams.
By design, Job Inspector will never allow making any changes to any job of CloverDX Server.
Job Inspector supports all types of jobs except of profiler job (*.cpj).
The tool is read-only, it does not allow editing of the displayed job.
Quickstart
The Job Inspector is available in the Sandboxes and Execution History sections.
Sandboxes
To open Job Inspector in Sandboxes, select a job and open the Job Inspector tab in the detail of the job.
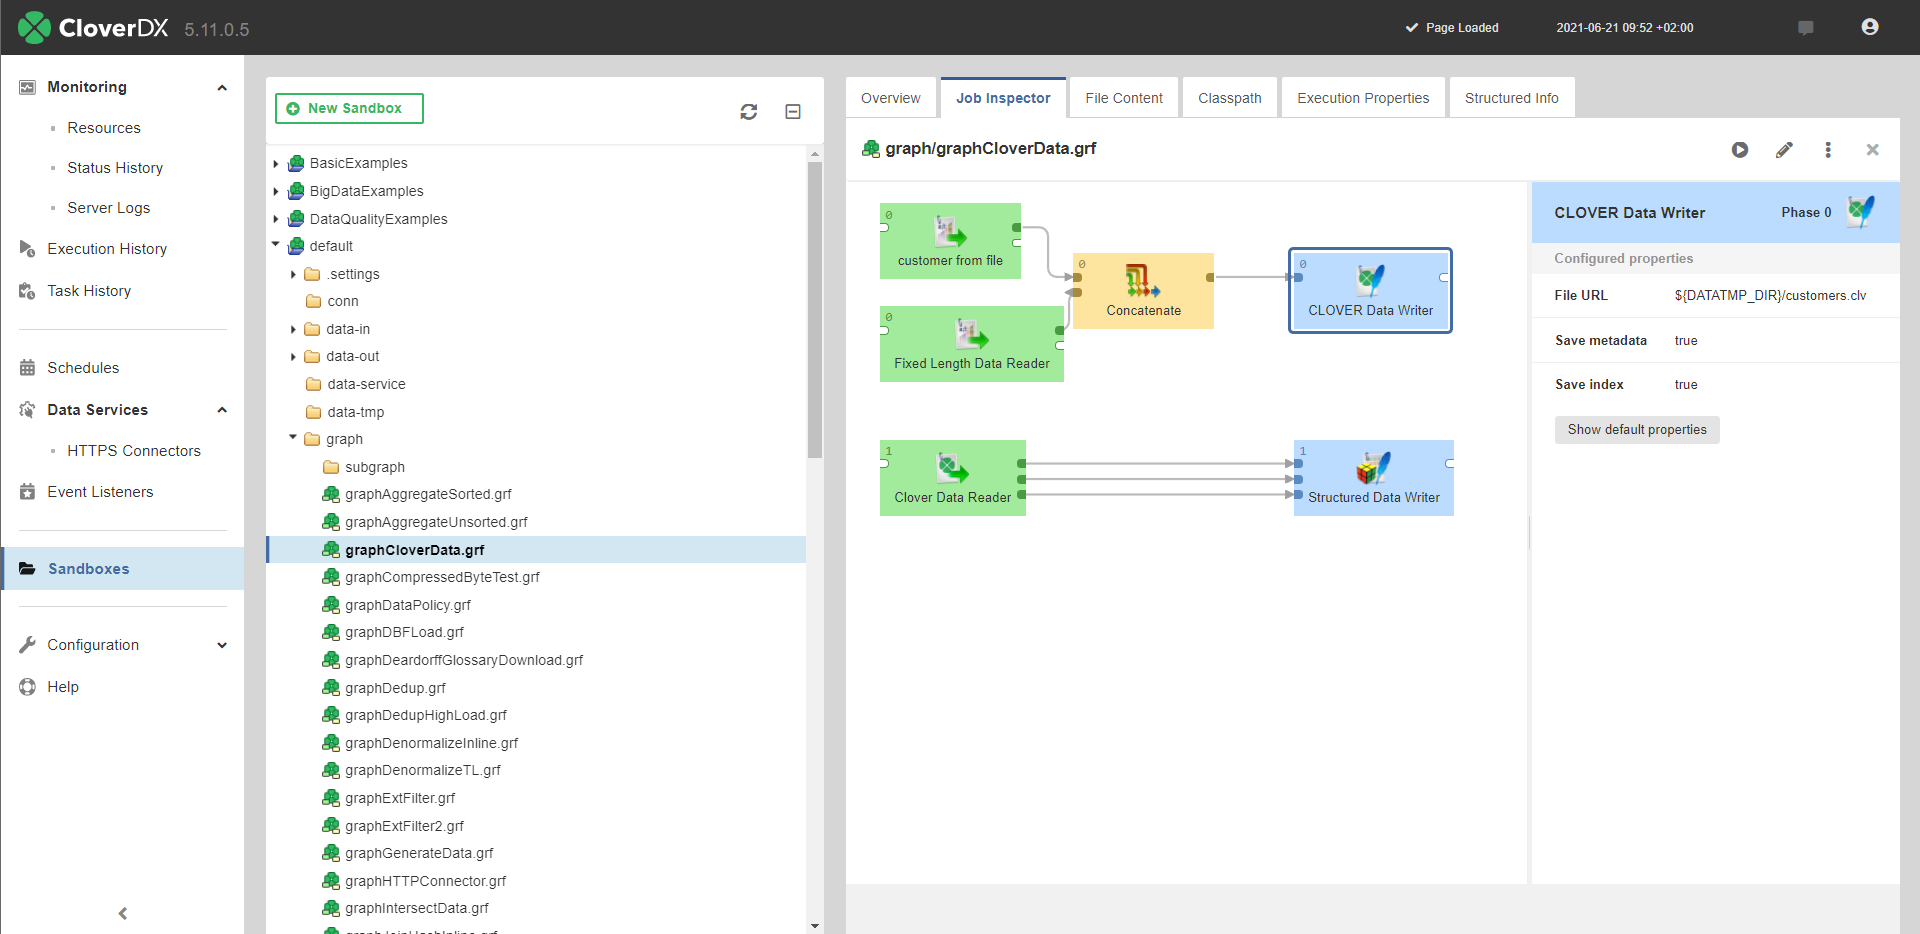 |
Figure 39.2. Job Inspector in Sandboxes
Execution History
To open Job Inspector in Execution History, select a job run from the list and open the Job Inspector tab in the detail of the run.
When the Job Inspector is opened from the Execution History, it contains not only job content but also information about the job run - numbers of records, component statuses and run execution log. Error message is available for failed components. It's possible to inspect component's configuration and metadata on the edges.
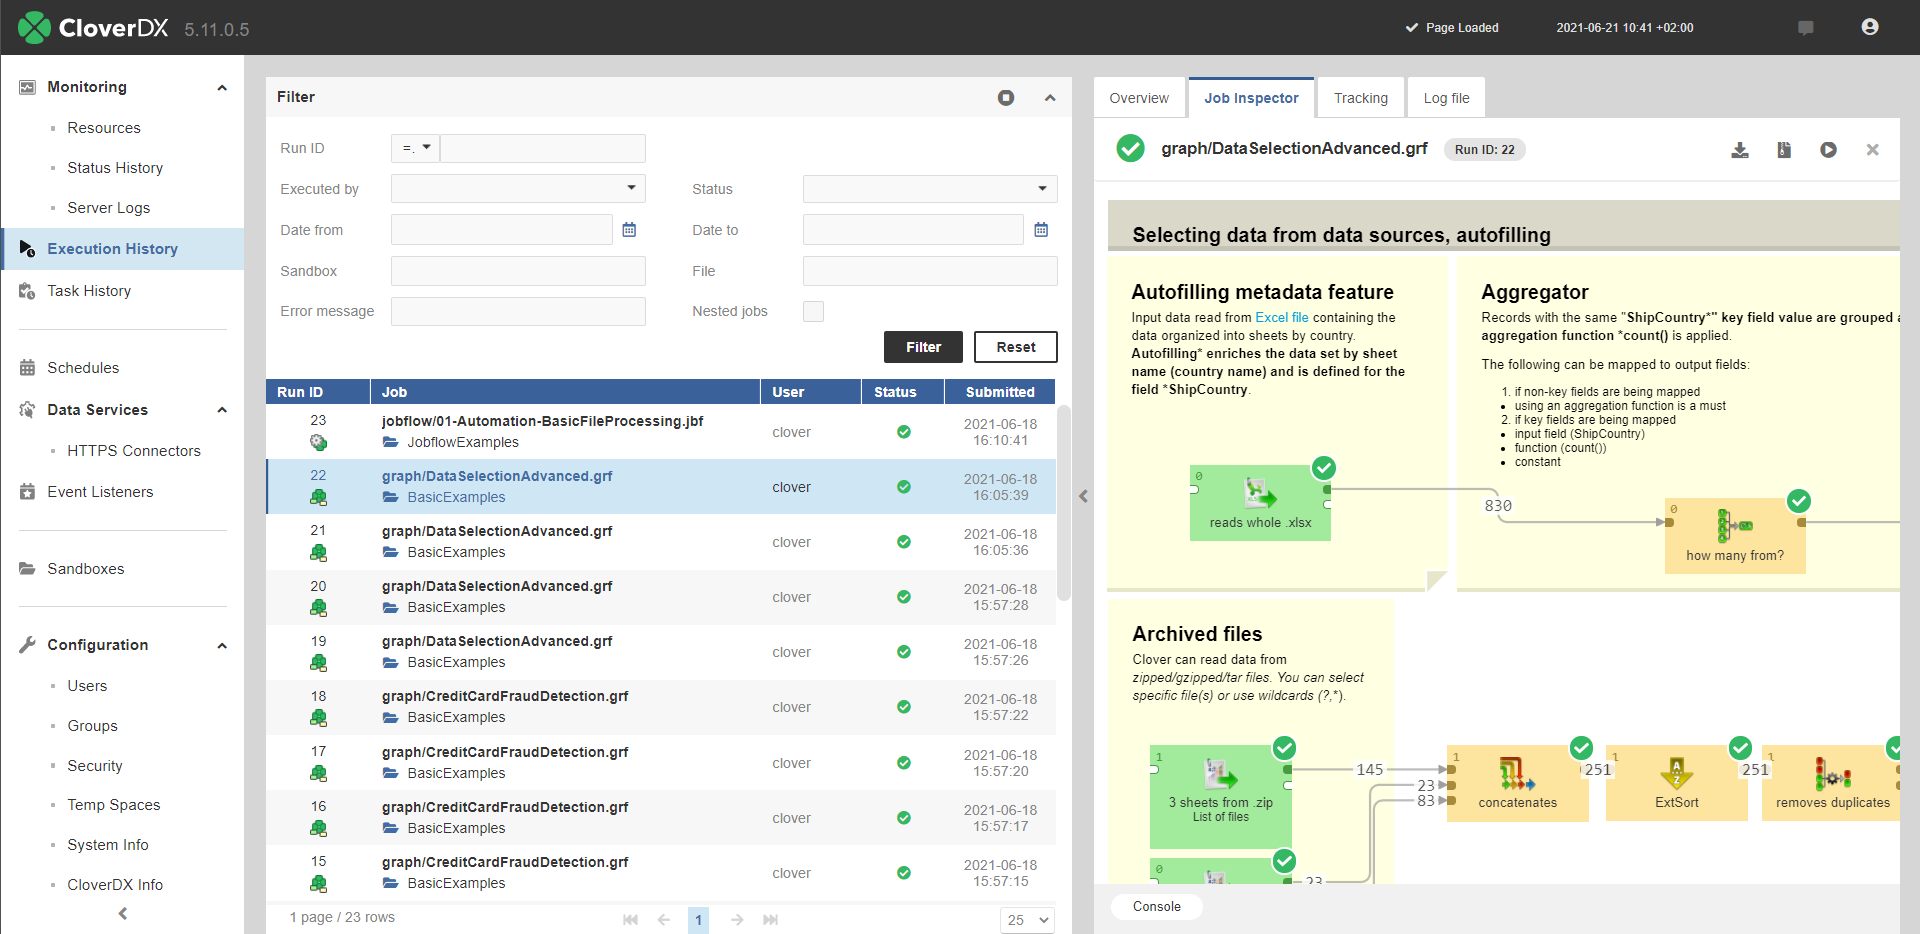 |
Figure 39.3. Job Inspector in Execution History
Using the Job Inspector
Job Panel

Figure 39.4. Job Inspector - Job Panel
Is the main section of Job Inspector. Job panel visualizes data flow using Components and Edges. Its contents are responsive and allow basic interaction. The selection of any item on this panel will show its properties in the Detail panel. For larger transformations, it is possible to move the view using mouse drag action. Zoom in/out is via mouse wheel. Other panels can be opened or closed using the buttons below the Job panel.
Detail Panel
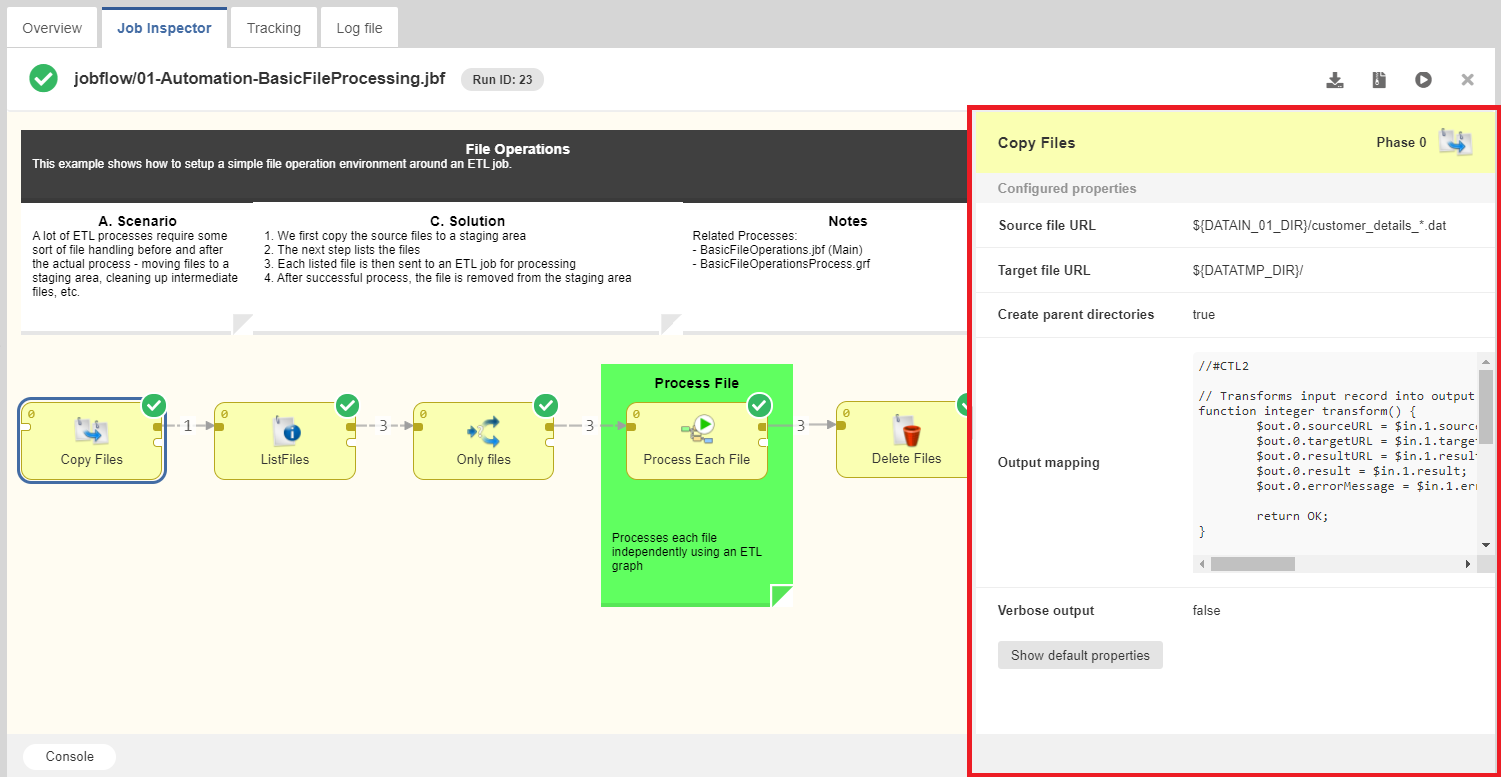 |
Figure 39.5. Job Inspector - Detail Panel
When there is an item active, the Detail panel is visible and shows different content based on the active item.
In general, the Detail panel shows the active item's settings and properties. In the case of a Component that was terminated due to an error, it also shows an error message as a cause of failure.
Detail panel for components contains two lists:
- Configured properties - list of properties configured by a user
- Default properties - rest of the component properties with default values
Moreover, when component has an error status, error detail is displayed here.
Detail panel for edges contains info about metadata.
Log Panel

Figure 39.6. Job Inspector - Log Panel
Log panel is specific for jobs, currently running or executed in the past - i.e. only available when Job Inspector is opened from Execution History module.
It is possible to show / hide the Log panel using the button, located below Job Inspector.
Log panel displays execution log, same as is available in a separate tab of CloverDX Server's Execution History module or CloverDX Designer's Console view.
Configuration
There are configuration properties related to the Job Inspector, see: