Version
Creating a Graph
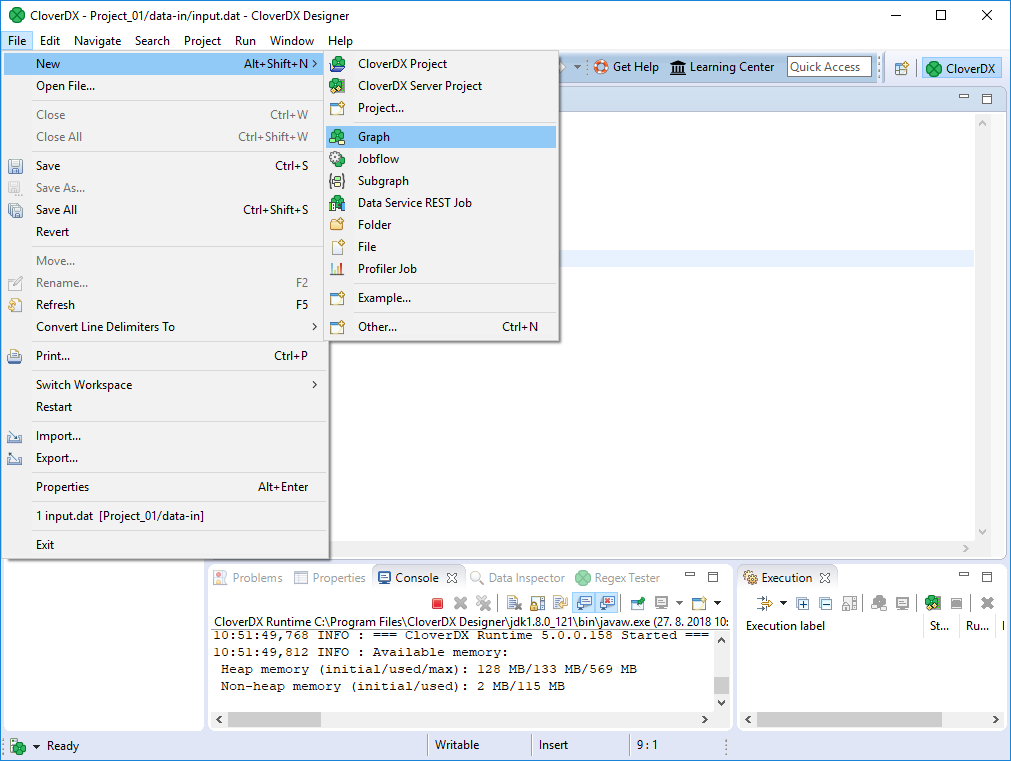
After creating a new project, create a new graph: select from the main menu. The graph is a recipe of your data transformation.
Figure 455. Creating a New Graph
Give a name to the graph and choose a directory for it.
We choose graph as the graph name. CloverDX Designer gives it the .grf extension automatically.
CloverDX Designer offers the graph subfolder.
It is the recommended place for graphs.
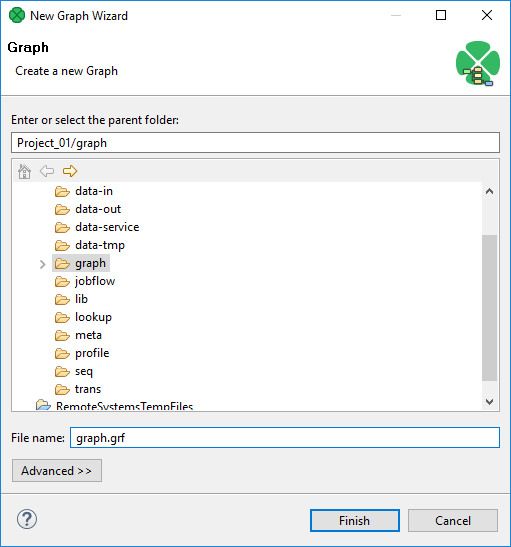
Figure 456. Selecting a Folder for the Graph and a Name of a New Graph