Version
Resources
After logging into CloverDX Server you are automatically redirected to the Resources section, which provides an overview of the Server’s current state and recent history from the technical point of view (e.g., the heap space allocated to the Server worker and core or the system memory and CPU utilization). This section also allows you to manage the Server core and worker processes. The appearance of the Resources section is different in standalone Server environments and Cluster environments: see Standalone Server View and Cluster View.
Standalone Server View
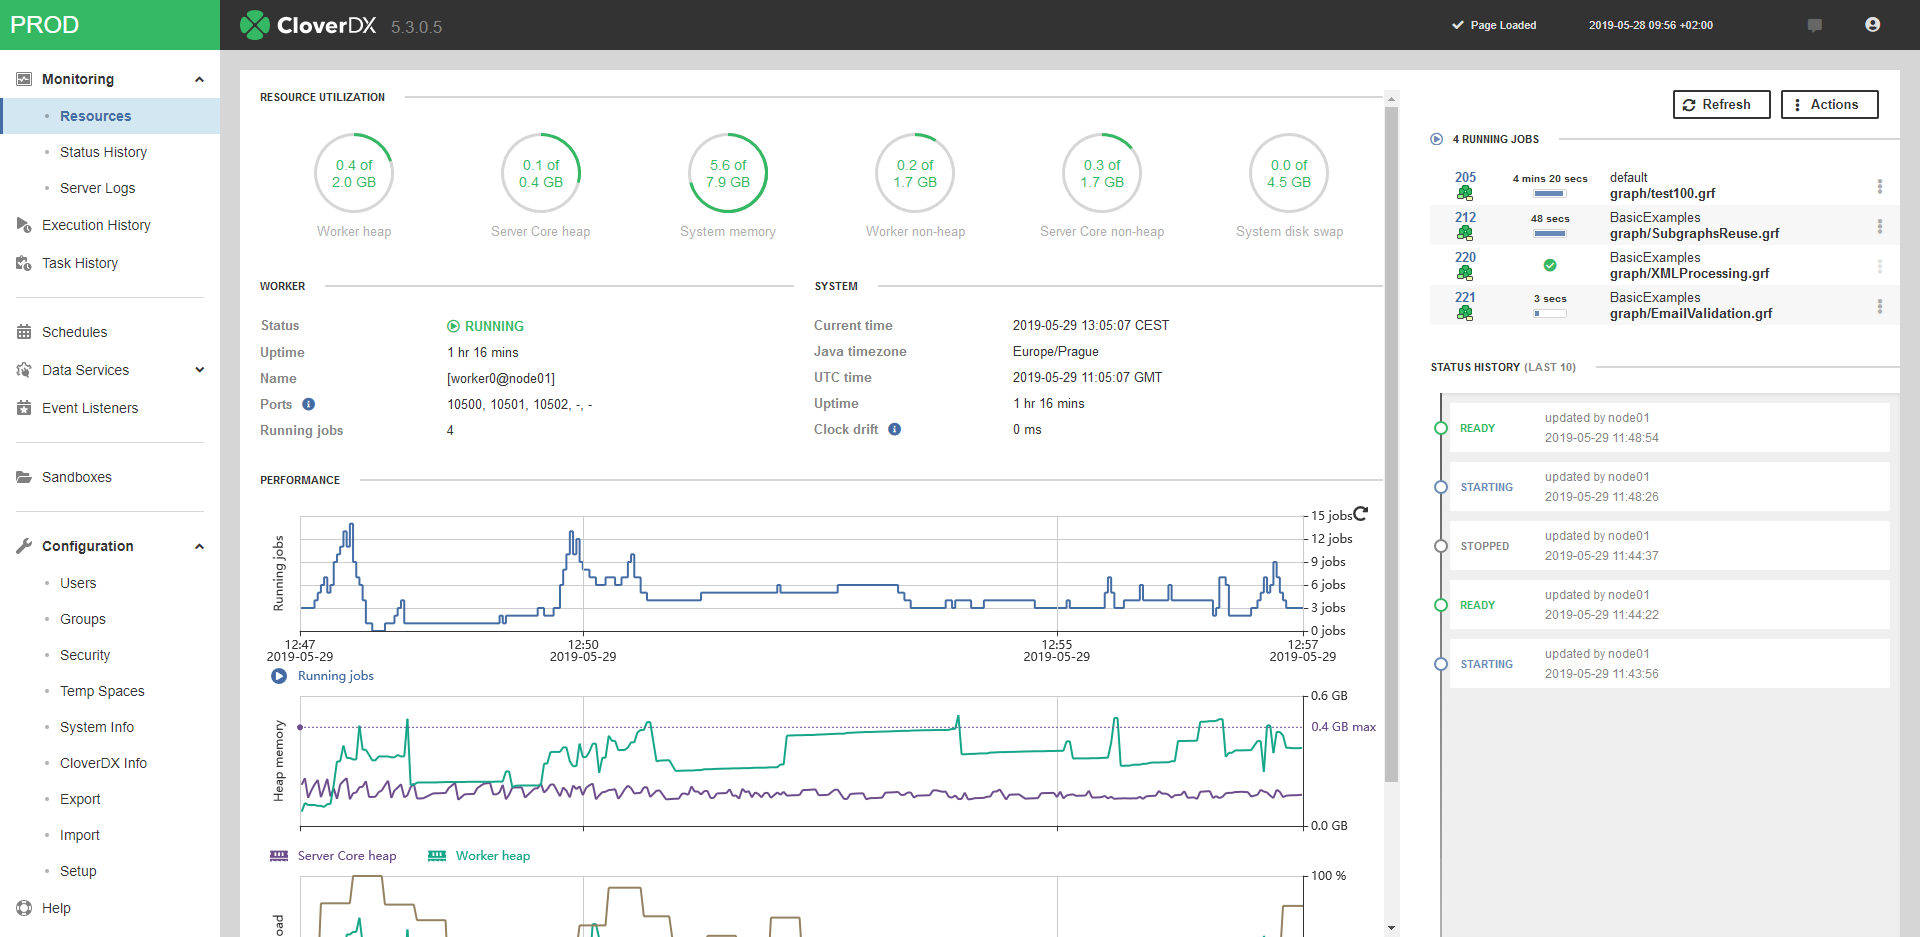
In a standalone Server environment, an overview of information about resource utilization and performance of CloverDX Server will be displayed. You can also manage the Server core and/or worker processes here. The information on this page is grouped into several panels and refreshed every 10 seconds. The following panels are displayed by default:
The following panels can be optionally displayed by using the Show Details Actions option:
Figure 75. Standalone server detail
Resource Utilization Panel
The Resource Utilization panel shows the heap and non-heap memory currently allocated to the Server worker and core processes, system memory, and system disk swap.
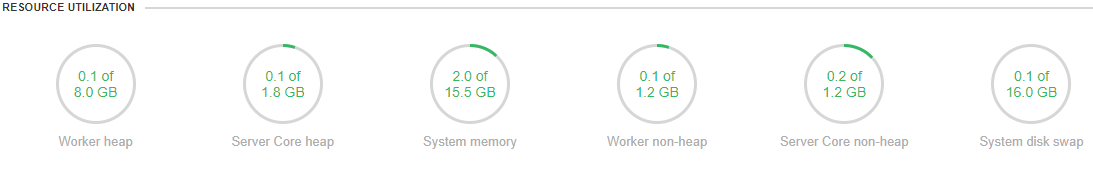
Figure 76. Resource Utilization
Worker and System Panels
These two panels display information about the worker process (e.g., current state or uptime) and operating system (e.g., current time, timezone, and system uptime).
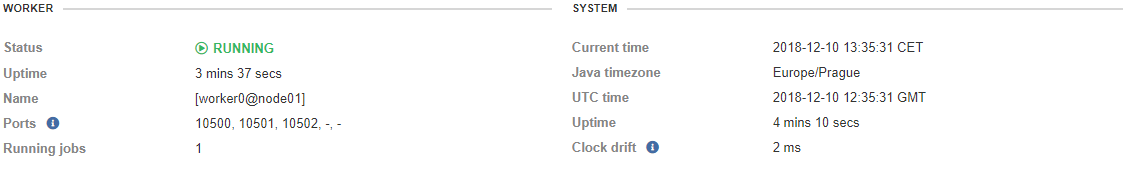
Figure 77. Worker
Performance Panel
The Performance panel includes three line charts: Running jobs, Heap memory, and CPU load.
You can display a tooltip with detailed information for a selected point in time by hovering over the charts. For better visibility, you can enable/disable individual lines in the charts by clicking on their label below the respective graphs.
You can modify the displayed time interval by hovering over one of the charts and mouse scrolling or using the slider at the bottom of this section. The slider allows you to set the start and end time intervals individually. By default, the maximum time interval for the charts in the Performance panel is 24 hours. This value can be modified using the cluster.node.sendinfo.stats.interval property.
The Jobs chart displays the number of running and enqueued jobs.
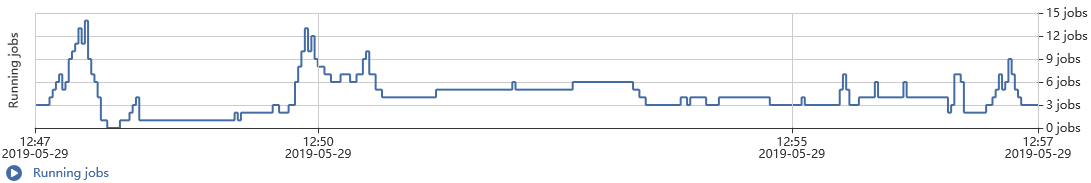
Figure 78. Running Jobs Chart
The Heap memory chart displays the amount of used Server core and worker heap memory.
Note that the heap memory is constantly oscillating, even in an idle state, since it is periodically managed by the JVM garbage collector (i.e., the temporary data required for running CloverDX Server and Worker is periodically removed from/allocated to the heap memory).
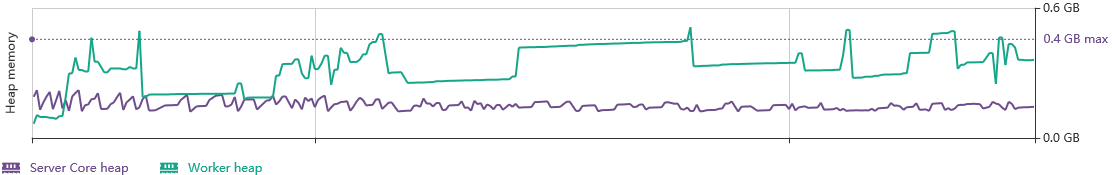
Figure 79. Heap Memory
The CPU chart displays information about CloverDX Server core, worker, and system CPU load.
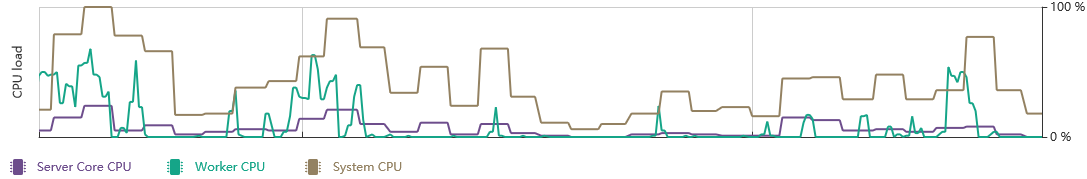
Figure 80. CPU Load
Running Jobs / Enqueued Jobs Panel
The Running jobs / Enqueued Jobs panel lists the 10 most recent currently running or enqueued jobs. This panel is visible only if there are any running or enqueued jobs.
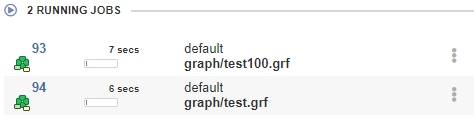
Figure 81. Currently Running jobs
Status History Panel
The Status history panel displays core and worker status history since the restart of the Server.
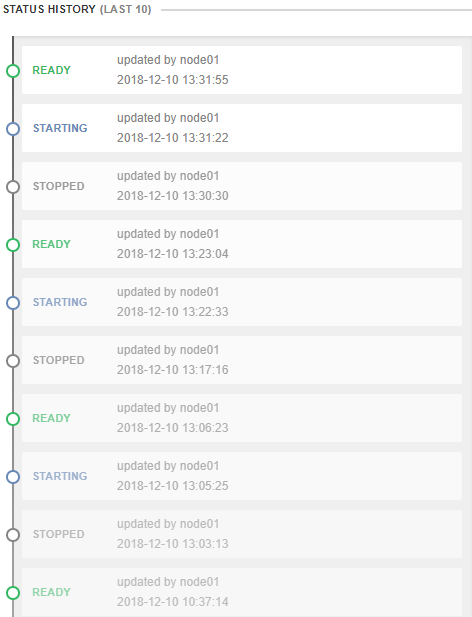
Figure 82. Status History
Users' Accesses Panel
This panel lists information about activities on files performed by users. The list displays a timestamp of an event, username, IP address, and name of the method.
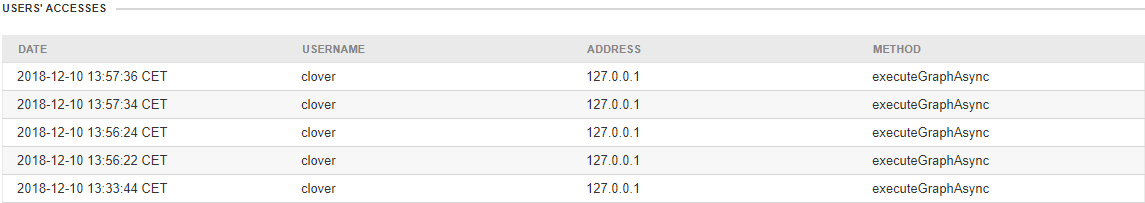
Figure 83. Users' Accesses Panel
License Panel
The License panel contains license information like the license number, license expiration date, and license location.
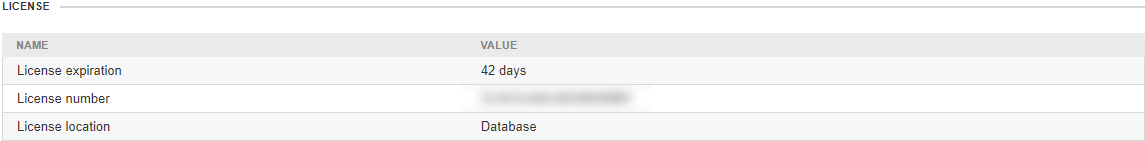
Figure 84. System
Classloader Cache Panel
The Classloader cache panel lists all currently cached classloaders. The classloader cache may be empty as classloader caching is disabled by default.
Status Panel
The Status panel displays information like current node status, heap and non-heap memory usage, Java version, exact CloverDX Server version, JDBC driver used to connect to the system database, etc.
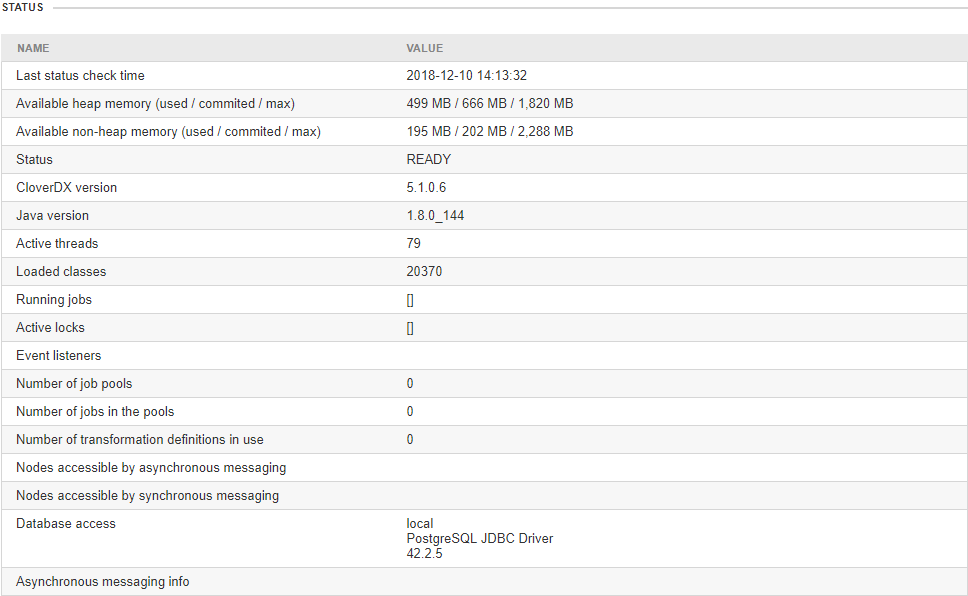
Figure 85. Status
Resource Utilization Detail Panel
The Resource Utilization Detail panel provides additional information about Server utilization of operating system resources.
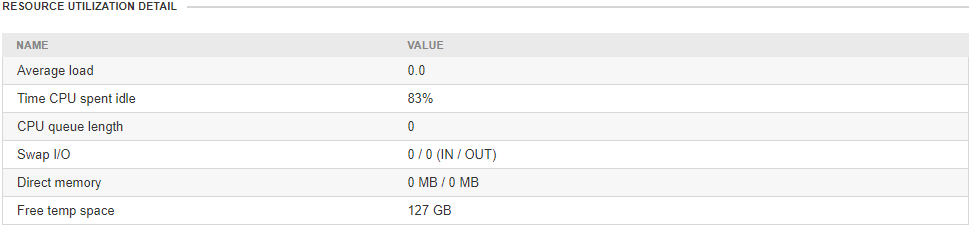
Figure 86. Status
Heartbeat Panel
The Heartbeat panel lists heartbeat events between the Server core and system database.
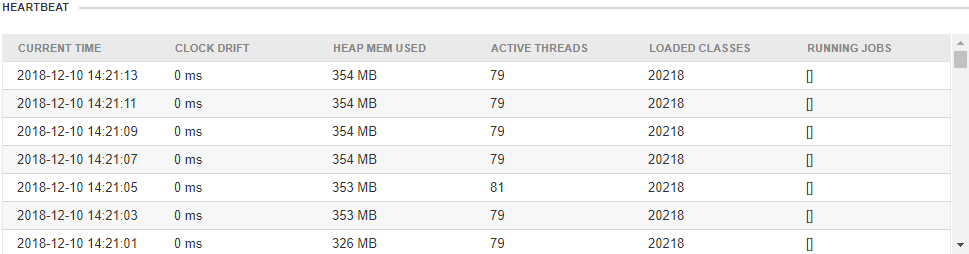
Figure 87. Heartbeat
Threads Panel
The Threads panel lists Java threads and their states.
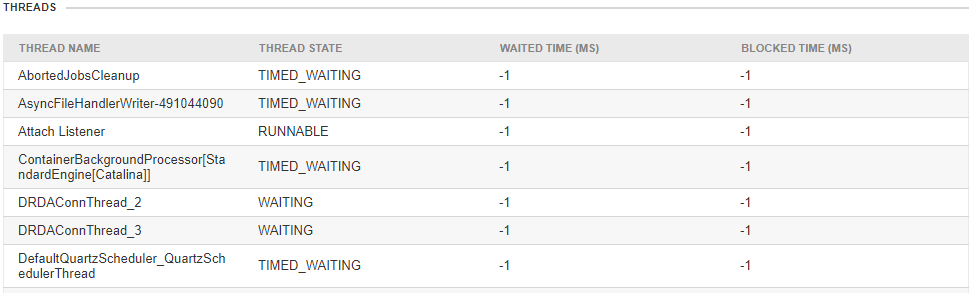
Figure 88. Threads
Quartz Panel
The Quartz panel lists scheduled actions: their name, description, start time, end time, time of the previous event, and the time of the next event.
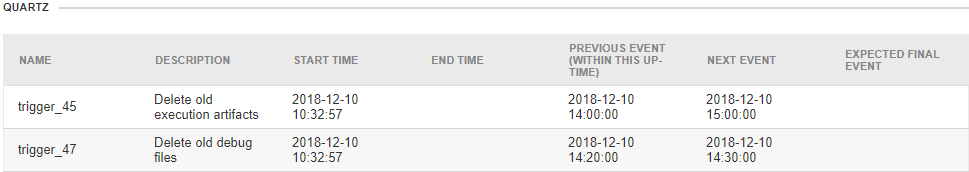
Figure 89. Quartz
Cluster View
After logging into the CloverDX console in a Cluster environment, the Resources section will by default display an overview of all configured Cluster nodes. The information is grouped into several panels:
-
List of Cluster nodes, their resource utilization, URL, uptime, and the number of currently running and enqueued jobs. In the nodes list on the left side, you can easily see to which node you are currently connected. By default, the check boxes next to each node are selected, allowing you to quickly control all nodes at once. Nodes can be suspended gracefully (i.e., nodes will be suspended only after all currently running jobs on the nodes have finished) by selecting the nodes and clicking on the Suspend button. If you want to suspend nodes forcefully use the Suspend At Once button instead. To resume suspended nodes use the Resume button.
-
Status history panel, which displays the last 10 status changes from all Cluster nodes.
-
Running jobs panel, which will be displayed only when there are currently running jobs.
The information in this section is automatically refreshed every 10 seconds. If you want to refresh it yourselves or stop refreshing it, use the Refresh or Stop Refreshing buttons, respectively.
In the nodes list on the left side, you can easily see to which node you are currently connected.
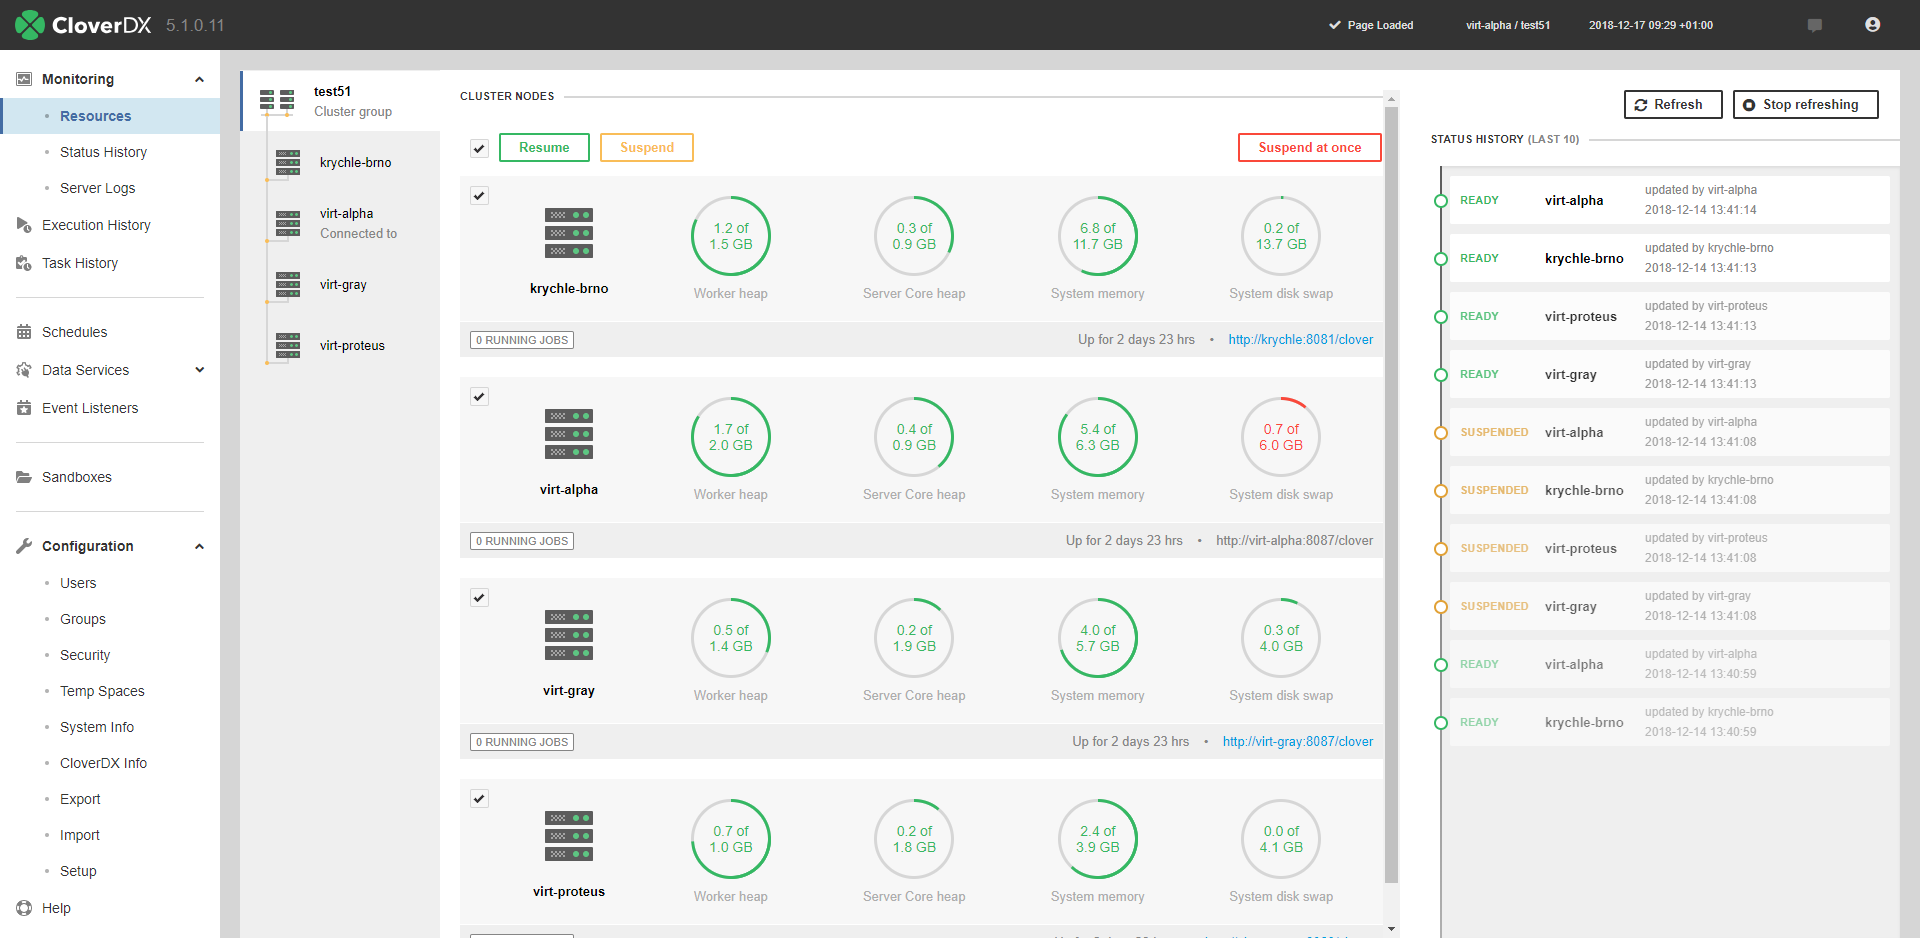
Figure 90. Cluster View
Node Detail View
By clicking on a specific node in the node list on the left side, you will be redirected to a node view, which displays the same kind of information as described in the Standalone Server View section, and which allows you to manage the Server core and worker processes on the selected node.
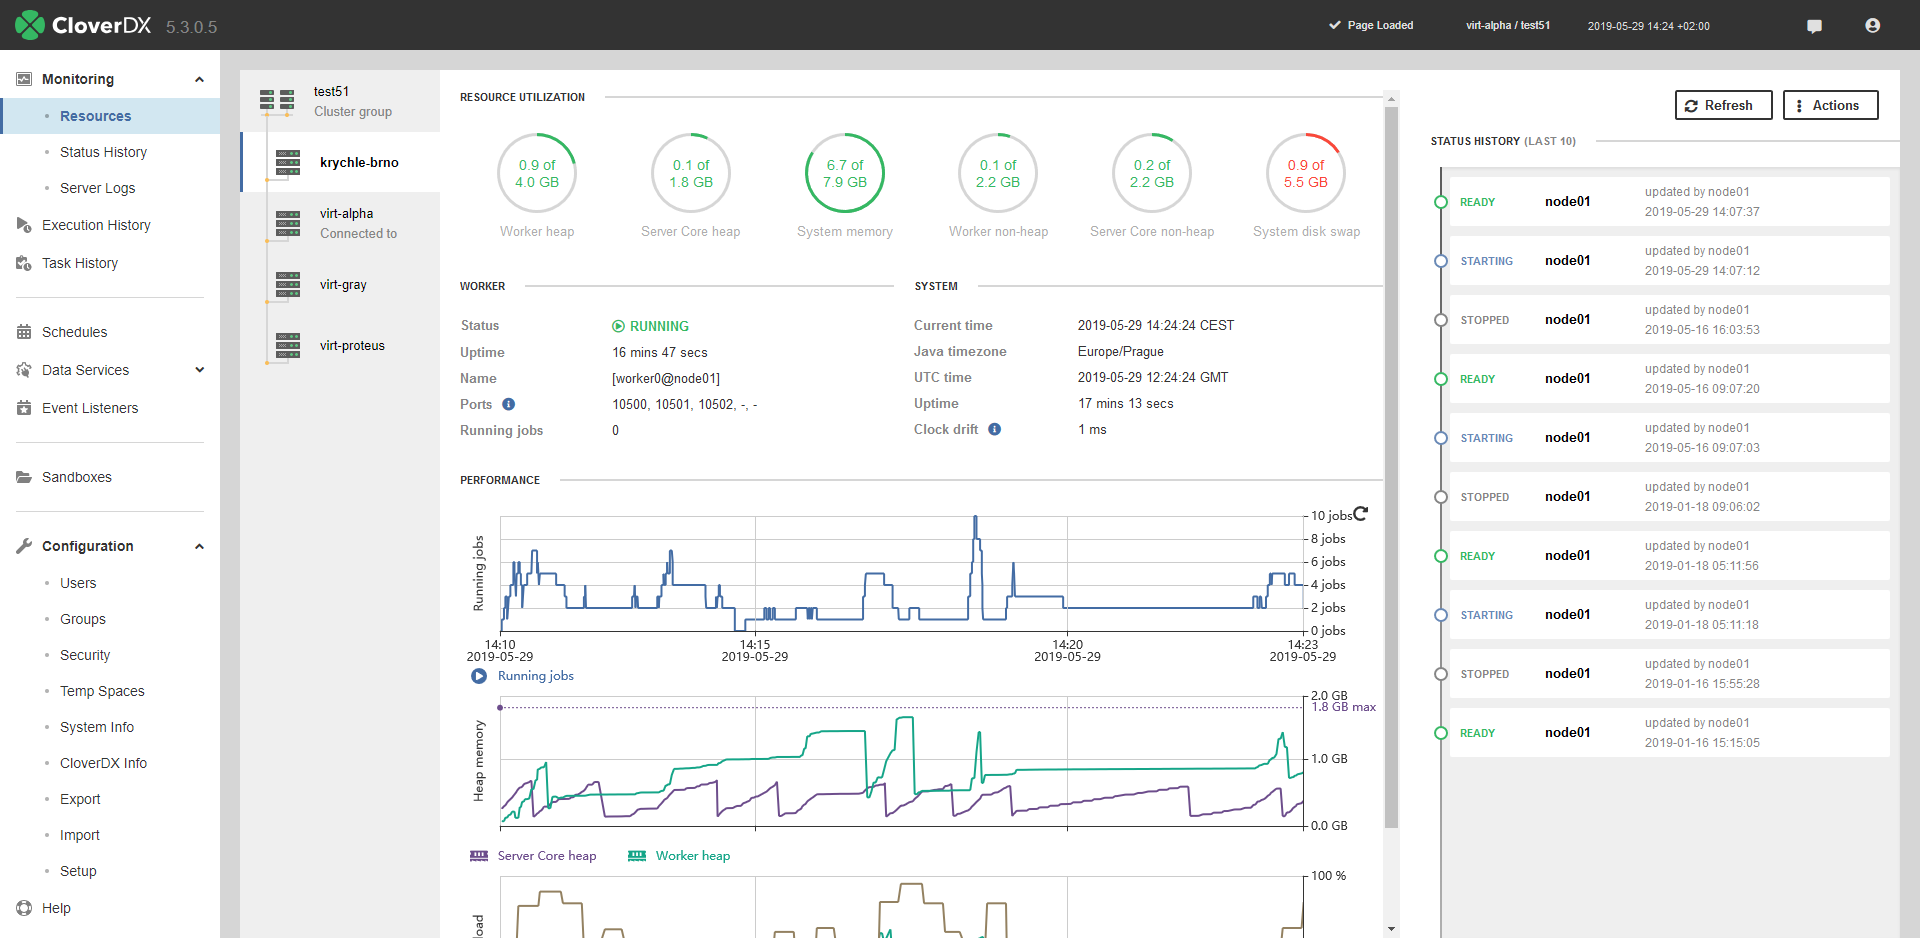
Figure 91. Node detail
Server Management
The Resources section allows you to control the Server core and worker processes, as well as display additional debug information. The controls can be found under the Actions menu in the upper right corner. When connected to a standalone Server environment, this menu will be available right away when you navigate to the Resources section. In a Cluster environment, the menu is available in a node detail view after clicking on a specific node in the node list. In the Actions menu, the following operations can be performed:
1. Starting Worker
If the worker process is not running, you can use the Start worker option to start it back up.
2. Restarting Worker
Depending on if you want to let the currently running jobs finish first select one of the options:
-
Finish jobs and restart worker will wait for all currently running jobs to finish before restarting the worker.
-
Restart worker now will forcibly kill all currently running jobs and restart the worker immediately.
3. Displaying Worker Log
The Go to worker logs option will redirect you to the Server Logs section under Monitoring and display the latest information in the worker log. For more information about server logs see Server logs.
4. Showing Worker Command Line Arguments
By selecting the Show worker command line option, the command line arguments and parameters used by the worker will be displayed.
See also Properties on Worker’s Command Line.
5. Suspending Server Core
When a Server core is suspended, features like Schedulers, Event Listeners, or Data Apps will be disabled. Manual execution of graphs, jobflows, and tasks is still possible with explicit confirmation. Depending on if you want to let the currently running jobs finish first, select one of the options:
-
Suspend server core will wait for all currently running jobs to finish before stopping the server core.
-
Force suspend server core will forcibly kill all currently running jobs and stop the core immediately.
6. Resuming Server Core
To resume a suspended Server core use the Resume server core option.
7. Restoring Dismissed Warnings
CloverDX Server shows warnings if it detects possible issues with the state of the Server or its configuration (e.g., when the Server is under heavy load a warning will appear in the Resources section, or when worker heap memory is not set, a warning will appear under Configuration > Setup > Worker). If you do not consider these warnings to be an issue, you can dismiss them by clicking on the X button at the end of the warning. Dismissing messages dismisses them for all users. Messages regarding worker configuration get renewed after changing its configuration and after restarting the worker. Messages regarding the Server Core are renewed after the restart of the Server.
Dismissed warning messages can be restored by using the Show dismissed warnings option.
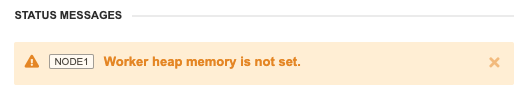
Figure 92. Dismissible warning message
8. Displaying / Hiding Additional Debug Information
To display additional debug information, e.g., a detailed overview of memory utilized by CloverDX Server, or a list of threads used by the core, use the Show Details option. After clicking on this option, the debug information will appear at the bottom of the page under the Performance section. To see what panels will appear when using this option, refer here. To hide the debug information use the Hide details option.
9. Disabling / Enabling of Automatic Refresh
By default, the information in the Resources section is refreshed automatically every 10 seconds. If you do not want the information to be refreshed, use the Stop refreshing option. To enable it again, use the Start refreshing option.