Chapter 17. Logging
| Main Logs |
| Another Useful Logging Settings |
| Access Log in Apache Tomcat |
| Application Server Logs |
| Graph Run Logs |
| Server Audit Logs |
| Designer-Server Integration Logs |
| Performance Log |
Main Logs
Since 5.2, CloverDX Server uses the Log4j 2 library for logging. The WAR file contains the default Log4j 2 configuration.
Location of the Log4j 2 configuration file is:
Server Core:
[clover.war]/WEB-INF/log4j2.xmlWorker:
[clover.war]/WEB-INF/worker/cloveretl.server.worker.jar/log4j2.xml
By default, log files are produced in the directory specified by
the java.io.tmpdir system property in the cloverlogs subdirectory.
The java.io.tmpdir system property usually points to a common system temp directory, i.e. /tmp.
On Apache Tomcat, it is usually the $TOMCAT_HOME/temp directory.
You can customize the logging configuration for both Core and Worker by supplying own log4j2.xml:
Server Core:
Define a new web application context parameter
log4jConfigurationwith the full path to the file. For example, in the case of Apache Tomcat, create/update the Context configuration file and add the following line:<Parameter name="log4jConfiguration" value="file:///C:/path/to/log4j2-server.xml" />Restart CloverDX Server.
Worker:
Using worker.jvmOptions, define a new system property
log4j.configurationFilewith the full path to the file:worker.jvmOptions= -Dlog4j.configurationFile=file:///C:/path/to/log4j2-worker.xmlRestart Worker.
![[Important]](../figures/important.png) | Important |
|---|---|
You must provide complete configuration as the supplied file will completely override log4j configuration shipped with CloverDX Server. It is therefore best to copy out and modify the configuration shipped with Server (see above for location). If you used a custom Log4j configuration in CloverDX Server 5.1 and older, you will have to migrate to Log4j 2 configuration in CloverDX Server 5.2. For configuration details, see Configuration of Log4j 2. |
Note: since such a configuration overrides the default configuration, it may influence Graph run logs. So your own log configuration has to contain following fragment to preserve Graph run logs:
<logger name="Tracking" additivity="false">
  <level value="debug"/>
</logger>
Another Useful Logging Settings
These system properties allow for logging of HTTP requests/responses to stdout:
Client side:
com.sun.xml.ws.transport.http.client.HttpTransportPipe.dump=true
(For more information, see the Working with CloverDX Server.)
Server side:
com.sun.xml.ws.transport.http.HttpAdapter.dump=true
Access Log in Apache Tomcat
If you need to log all requests processed by the server,
add the following code to $CATALINA_HOME/conf/server.xml.
<Valve className="org.apache.catalina.valves.AccessLogValve" directory="logs"
    prefix="localhost_access_log" suffix=".txt"
    pattern="%h %l %u %t %D %r %s %b" />
The format defined above has following meaning
[IP address] [date-time] [processing duration in milliseconds] [method] [URL] [protocol+version] [response code] [response size]
The log will look like the next line
172.17.30.243 - - [13/Nov/2014:12:53:03 +0000] 2 "POST /clover/spring-rpc/clusterNodeApi HTTP/1.1" 200 1435"
See also Valve in documentation on Apache Tomcat.
Application Server Logs
If you use Apache Tomcat, it logs into $CATALINA_HOME/logs/catalina.out file.
Graph Run Logs
Each graph or jobflow run has its own log file – for example, in the Server Console, section Execution History.
By default, these log files are saved in the subdirectory cloverLogs/graph
in the directory specified by java.io.tmpdir system property.
It’s possible to specify a different location for these logs with the CloverDX graph.logs_path property.
This property does not influence main Server logs.
Server Audit Logs
Server Audit Log logs operations called on ServerFacade and JDBC proxy interfaces.
Audit logging can be enabled by setting (adding) the value of CloverDX property
logging.logger.server_audit.enabled to true.
In server GUI, you can change the property value in
→ → .
Audit logging is disabled by default.
The name of output file is server-audit.log.
The file is in the same directory as main server log files.
Default log level is DEBUG, so all operations which may do any change or another important operations (e.g. login or openJdbcConnection) are logged.
To enable logging of all operations, change log level to TRACE in the log4j configuration.
Each logged operation is logged by two messages: entering method and exiting method (if the exception is raised, it's logged instead of output parameters)
- Entering method (marked as "inputParams"). All method's parameters (except for passwords) are printed.
- Exiting method (marked as "outputParams"). Method's return value is printed.
- Exception in method (marked as "EXCEPTION"). Exception's stacktrace is printed.
Message also contains:
- username, if the user is known
- client IP address, if it's known
- Cluster node ID
- Interface name and the operation name
Values of transient and lazy initialized (in entity classes) fields and fields with binary content are not printed.
Designer-Server Integration Logs
The logging of Designer-Server integration can be enabled with logging.logger.server_integration.enabled configuration property.
The name of the log file is server-integration.log.
The log format is date and time, IP address of Designer, user name, operation, result of the operation (success/failure) and duration in milliseconds.
2018-03-07 16:42:00,525 10.0.3.2 user=clover, operation=executeGraph SUCCESS duration=576 ms
Performance Log
The performance log measures performance metrics that are useful for diagnostics of incidents such as slowdown of processing, restarts of Worker or Server Core etc. The metrics are such as CPU load, Java heap size, number of open files etc. CloverDX logs values of the metrics in regular intervals into the performance log.
Example of the performance log:
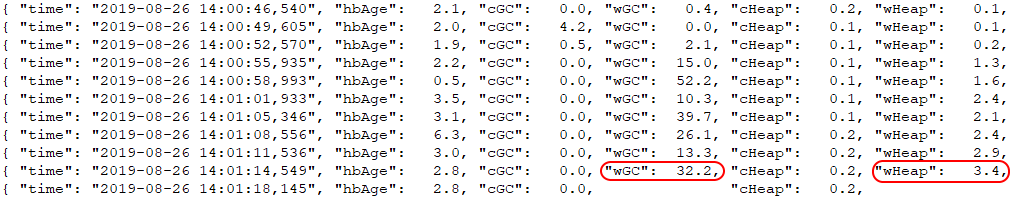
Figure 17.1. Performance log example
In the above example, the jobs in Worker require large heap space, which will soon cause the Worker's heap to fill and garbage collector to consume all CPU time of the Worker. The Worker will stop responding to Server and will be restarted.
Each line of the performance log is one entry, which is a JSON. The line contains a timestamp and values of metrics from Server Core and Worker. There can be short gaps in the log, e.g. under very high load the Worker might not be able to send the metric values for every entry. Long gaps indicate a more severe issue.
The performance log can be found in:
- Server Console Monitoring > Server Logs > PERFORMANCE page
{java.io.tmpdir}/cloverlogs/performance.log
The performance log can be disabled by setting configuration property logging.logger.performance.enabled=false
Table 17.1. Performance Log Metrics
| Metric Label in Log | Metric | Description | Unit | Collected in |
|---|---|---|---|---|
| time | Timestamp |
Date and time when metrics in this entry were collected. The timestamps should be even, i.e. there should not be significant time gaps between the log entries. By default, Server logs the metrics every 3 seconds. If the log entry contains only metrics from Worker (i.e. Server Core wasn't able to collect the metrics), then the timestamp will be for the time when Worker collected the metrics. | timestamp | core/worker |
| hbAge | Heartbeat age |
Age of latest Worker heartbeat (Worker sends regular heartbeat to Server Core to report its health). Measured as a difference between the current time and the time when the latest Worker heartbeat was received by Server Core. Heartbeat age should be typically a few seconds. Tens of seconds indicate a problem, typically overloaded Worker or Server Core. For example when running out of free heap the Worker will spend its time in GC and will have less capacity to send heartbeat. When the heartbeat age gets over a limit value (about a minute), the Server Core will restart the Worker. | seconds | core |
| cGC | Server Core garbage collector activity |
Percentage of CPU time spent in garbage collection for the Server Core, since the time of previous performance log entry. Typical values should be <20%, with occasional higher spikes. Long intervals of high GC activity indicate that the Server Core is running out of free heap. | 0-100% | core |
| wGC | Worker garbage collector activity |
Percentage of CPU time spent in garbage collection for the Worker, since the time of previous performance log entry. Typical values should be <20%, with occasional higher spikes. Long intervals of high GC activity indicate that the Worker is running out of free heap. High Worker GC activity will often be accompanied by short gaps in metrics reported by the Worker. | 0-100% | worker |
| cHeap | Server Core heap usage |
Amount of used java heap memory in Server Core JVM.
The value of used heap can rise up to maximum heap size of Server Core.
The maximum heap size of Server Core is set as the heap size for the Application Container running CloverDX Server, e.g. via the -Xmx argument.
Look in the | GB | core |
| wHeap | Worker heap usage |
Amount of used java heap memory in Worker JVM.
The value of used heap can rise up to maximum heap size of Worker.
Maximum size of Worker heap is set in the Worker configuration (Configuration > Setup > Worker, or worker.maxHeapSize configuration property).
Additionally, Worker logs the maximum Worker heap size in the | GB | worker |
| sysCPU | System CPU load |
Total CPU load of the machine on which Server runs. The system CPU load is caused by all processes running on the machine. The measured CPU load is average over last 10 seconds. If the system CPU load is significantly higher than the sum of Worker and Server Core CPU load for a long time, this indicates another CPU demanding process is running on the machine. Alternatively, high swap usage can cause high system CPU load. | 0-100% | core |
| cCPU | Server Core process CPU load |
CPU load that Server Core process introduces on the system. The Server Core CPU load is average over last 10 seconds. Typically, the Server Core CPU load should be low (<10%), as most processing is done by jobs running in the Worker. | 0-100% | core |
| wCPU | Worker process CPU load |
CPU load that Worker process introduces on the system. The Worker CPU load is average over last 10 seconds. | 0-100% | worker |
| jobs | Running jobs |
Number of currently running CloverDX jobs. If this Server is part of CloverDX Cluster, only jobs running on this node are counted. | number | core |
| cThread | Server Core threads |
Number of currently live threads in Server Core JVM. Typical values are up to hundreds. If the values continuously increase that can indicate a thread leak. | number | core |
| wThread | Worker threads |
Number of currently live threads in Worker JVM. Typical values are up to hundreds or low thousands. If the values continuously increase that can indicate a thread leak. | number | worker |
| swap | System swap |
Amount of memory swapped by OS to disk. Swap should be used as little as possible, as swapped processes are significantly slower. On Linux, swap should be in hundreds of MB or less. | GB | core |
| cFD | Server Core file descriptors |
Number of currently used file descriptors by Server Core. This metric is not available on Windows. If the values continuously increase that can indicate a file descriptor leak. Maximum number of open file descriptors has a limit configured in the OS. | number | core |
| wFD | Worker file descriptors |
Number of currently used file descriptors by Worker. This metric is not available on Windows. If the values continuously increase that can indicate a file descriptor leak. Maximum number of open file descriptors has a limit configured in the OS. | number | worker |
| cUptime | Server Core uptime |
Uptime of Server Core, i.e. of the Application Container running Server Core. | seconds | core |
| wUptime | Worker uptime |
Uptime of Worker. Useful metric to see when the Worker was restarted - the uptime is re-set to 0. | seconds | worker |
Example Scenarios:
Out of heap memory - if the Server Core or Worker run out of heap, it will be visible in the performance log by high GC activity (cGC or wGC) and by their heap usage (cHeap or wHeap) rising to the max heap available.
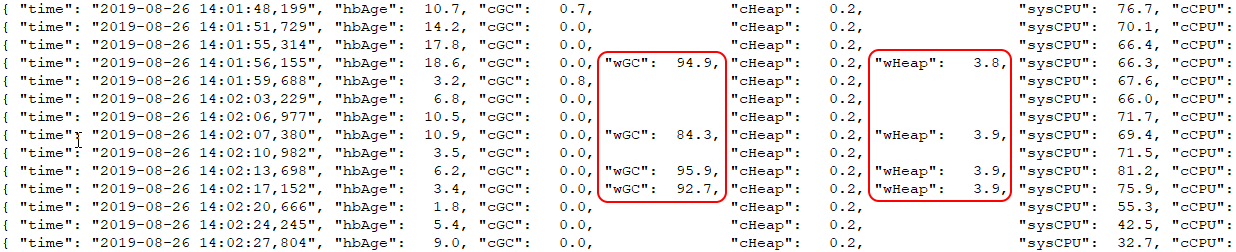
Figure 17.2. Worker running out of heap example
High swap usage - if the system swap is used too much (e.g. several GB) as indicated by the swap metric, then CloverDX will be typically slowed down noticeably, e.g. the jobs will run much slower. This can be caused by insufficient system memory for the heap size (remember that Java needs memory outside of heap). Or some other process is taking the memory. This is often accompanied by high system CPU load.
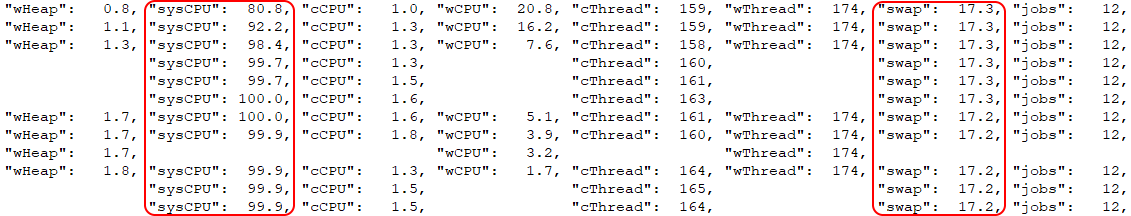
Figure 17.3. High swap usage example
Low limit of file descriptors - CloverDX uses a high number of open files for high performance processing. Default OS limit on maximum open files can be low (e.g. 4096). If the file descriptor metrics (cFD or wFD) rise to a high number and then an issue occurs (typically accompanied by "Too many open files" exceptions in all.log or job logs), then the cause is low limit on maximum open file descriptors (see the section called “Maximum Number of Open Files” in our documentation).

Figure 17.4. Low file descriptor limit example
Other process creating CPU load - if the system CPU load (sysCPU) is high, and significantly higher than Server Core + Worker CPU loads (cCPU + wCPU), then there's probably some other process producing high CPU load.