CloverDX Data Profiler GUI
The default application window layout is shown on figure below:
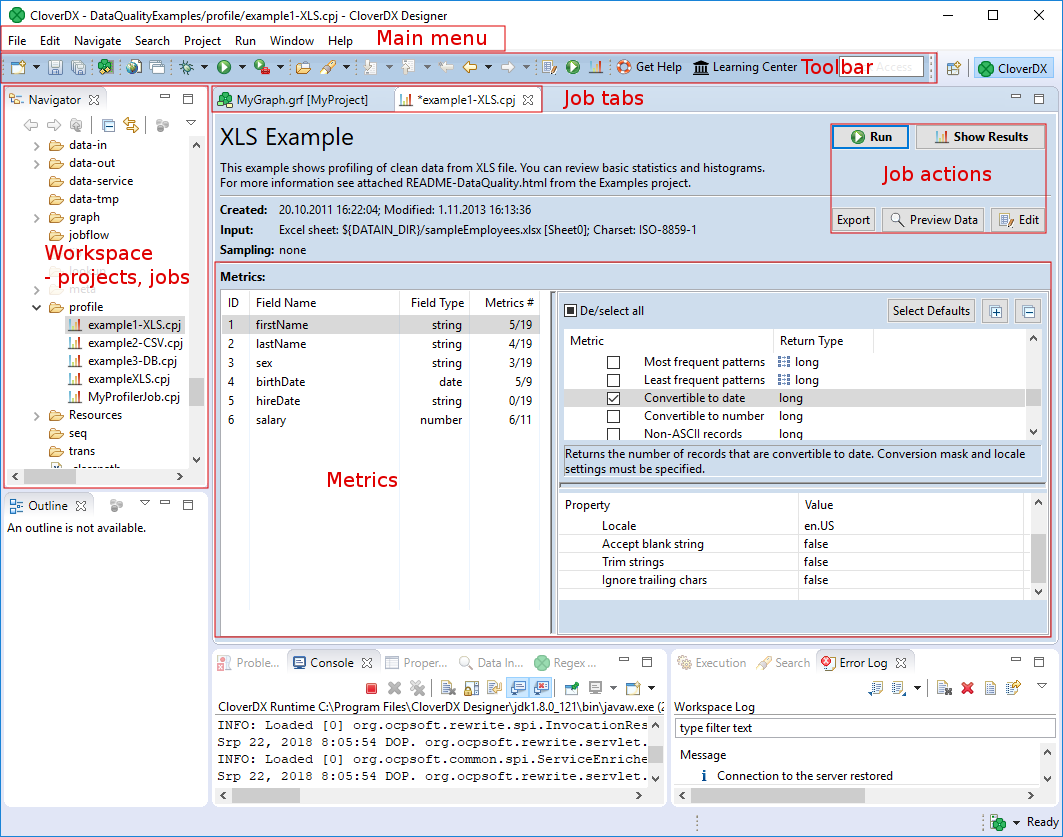
Figure 4.1. CloverDX Data Profiler GUI
As you can see, there are several key elements of the GUI:
Workspace - this is where all your projects are placed when you create them. Projects are filled with jobs, i.e. the data profiling scenarios.
Main menu - allows you to access most of the CloverDX Designer and Data Profiler functionality.
Toolbar - grants you access to the most frequent functions:
New - enables you to create a new project, profiler job, folder or others
Save - saves your work on the current job if you made any changes to it
Open Reporting Console - opens the Reporting Console inside the application
Open Reporting Console in a external browser - opens a new window inside your default web browser and displays the Reporting Console there
Edit properties of this job, Run this job, Show this job results - see Job actions below
Job actions - here you Edit a job, Run it or display run Results. See the section called “Running Jobs”.
Metrics - the central part of the job pane showing detailed metrics settings. This part shows up as soon as you double-click an existing job or create a new one. See the section called “Creating Jobs” and Appendix A, List of Metrics.
Property | Value pane - this is where some metrics are configured. See Metrics.