Resources
The Resources page displays information about resources and performance of the CloverDX Server. The information is grouped in several panels and refreshed every 10 seconds. The following panels are displayed by default:
By clicking → , you can display hidden panels with additional details which may help with troubleshooting.
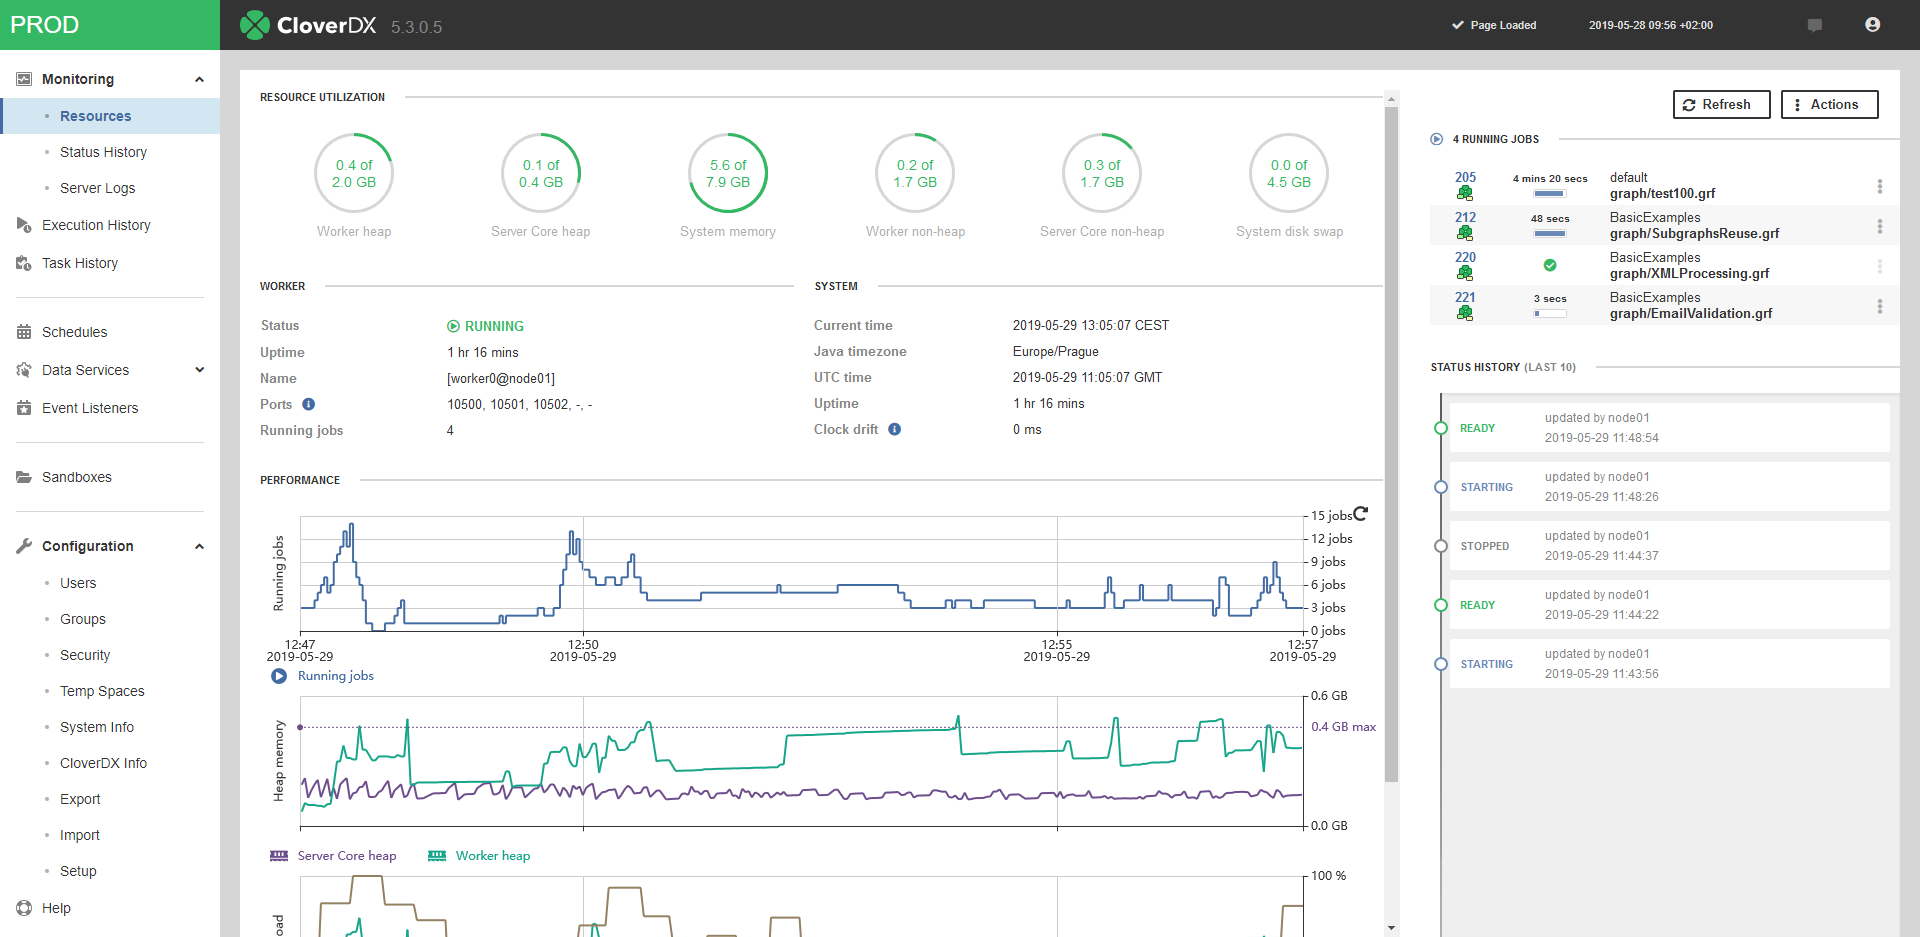 |
Figure 22.1. Standalone server detail
Instance Indicator
Instance Indicator is a small area located in the upper left corner of the GUI to which you can assign a unique color and label. This way, when working on multiple Server instances, you can easily distinguish between them.
Instance Indicator is shown only when either webGui.instance.color or webGui.instance.label is set.
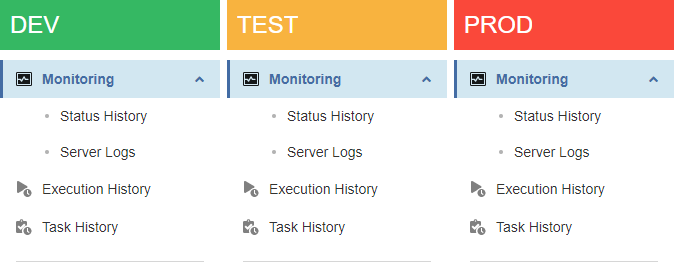
Figure 22.2. Instance Indicator
Resource Utilization
Resource Utilization panel shows the amount of used System memory, System disk swap Server Core heap memory, Server Core non-heap memory, Worker heap memory and Worker non-heap memory.
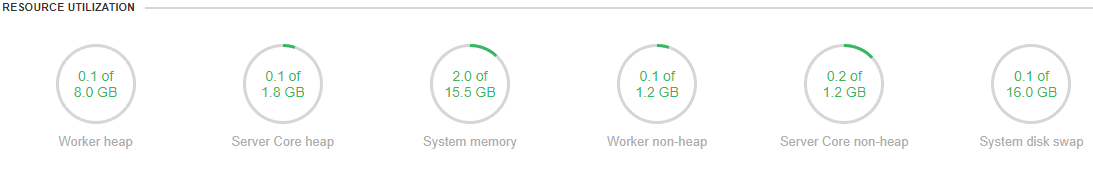
Figure 22.3. Resource Utilization
Worker and System
Contains basic information about Worker and operating system.
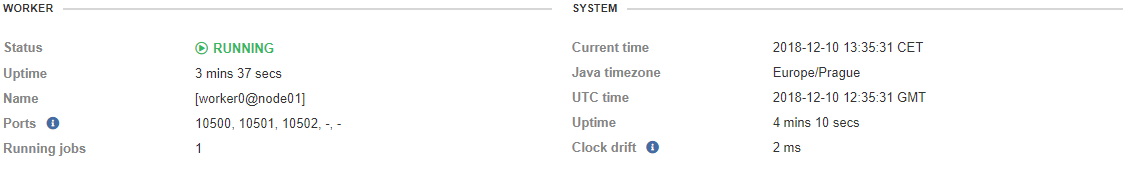
Figure 22.4. Worker
Performance Tab
The Performance tab displays three line charts: Running jobs, Heap memory and CPU load. By placing a mouse over the charts, you can see a detailed tooltip of a selected point in time. For better readability, you can enable/disable individual lines in the graphs by clicking their label below respective graphs. You can select the time interval by mouse scroll wheel or by using the slider at the bottom of the screen. The slider allows you to set the start and the end of the time interval individually. By default, the maximum time interval for the charts in Performance tab is 24 hours. The value can be changed using the cluster.node.sendinfo.stats.interval property.
Running Jobs
This line chart displays the number of currently running jobs.
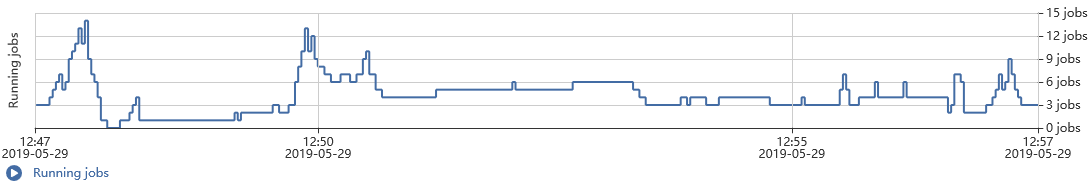
Figure 22.5. Running Jobs Chart
Heap Memory
The Heap memory chart displays the amount of used up Server and Worker heap memory.
Note that the heap memory is constantly oscillating, even in idle state, since it is periodically managed by JVM garbage collector (i.e. the temporary data required for running CloverDX Server and Worker is periodically removed from/allocated to the heap memory).
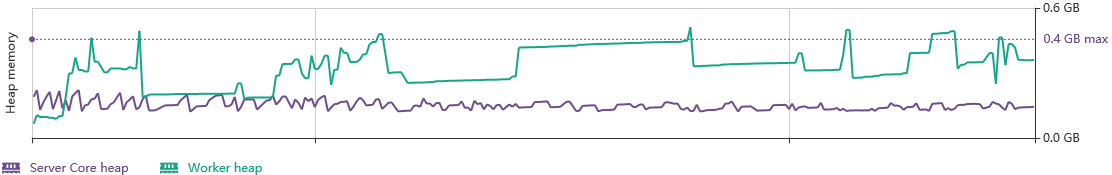
Figure 22.6. Heap Memory
CPU Load
The CPU chart displays information about Server Core, Worker and System CPU load.
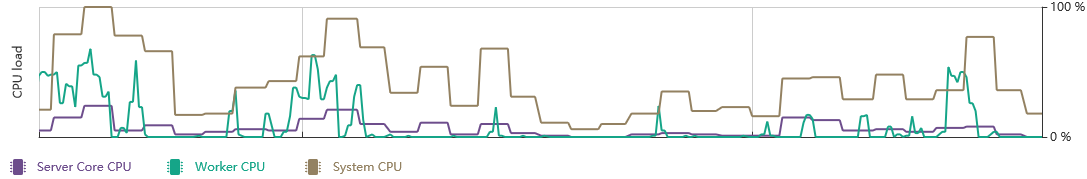
Figure 22.7. CPU Load
Running Jobs
Running jobs panel lists currently running jobs, 10 most recent runs are displayed.
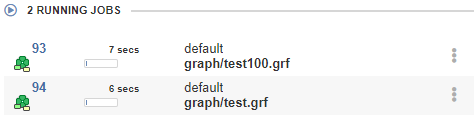
Figure 22.8. Running jobs
Status History
Status history panel displays node statuses history since restart of the Server.
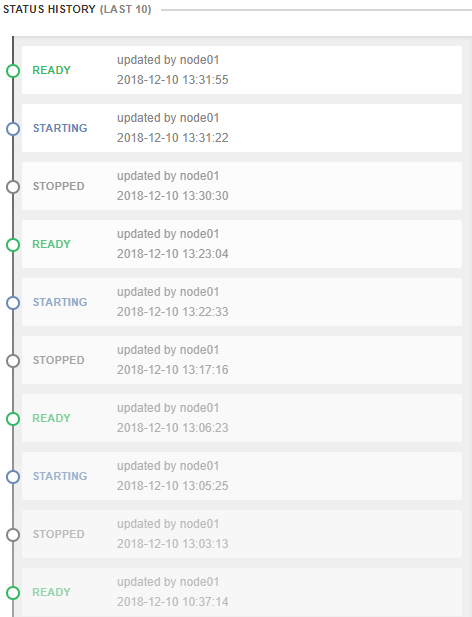
Figure 22.9. Status History
License
Contains information about license.
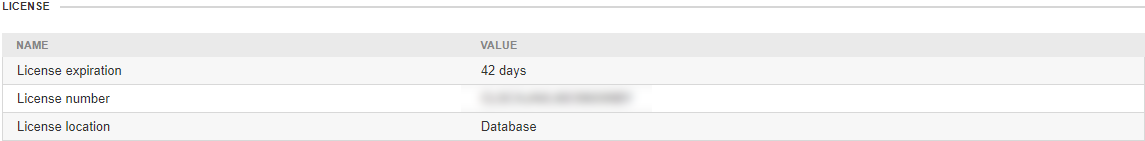
Figure 22.10. System
Users' Accesses
This panel lists info about activities on files performed by users. The list displays a timestamp of an event, username, address and name of the method.
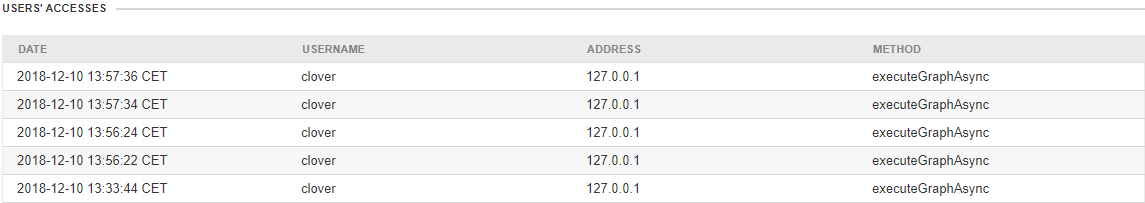
Figure 22.11. Users' Accesses panel
Classloader cache
Classloader cache lists all currently cached classloaders. The classloader cache may be empty as classloader caching is disabled by default.
Status
Status panel displays current node status since last server restart. It displays current server status, exact Java version, exact CloverDX Server version, way of access to database, etc.
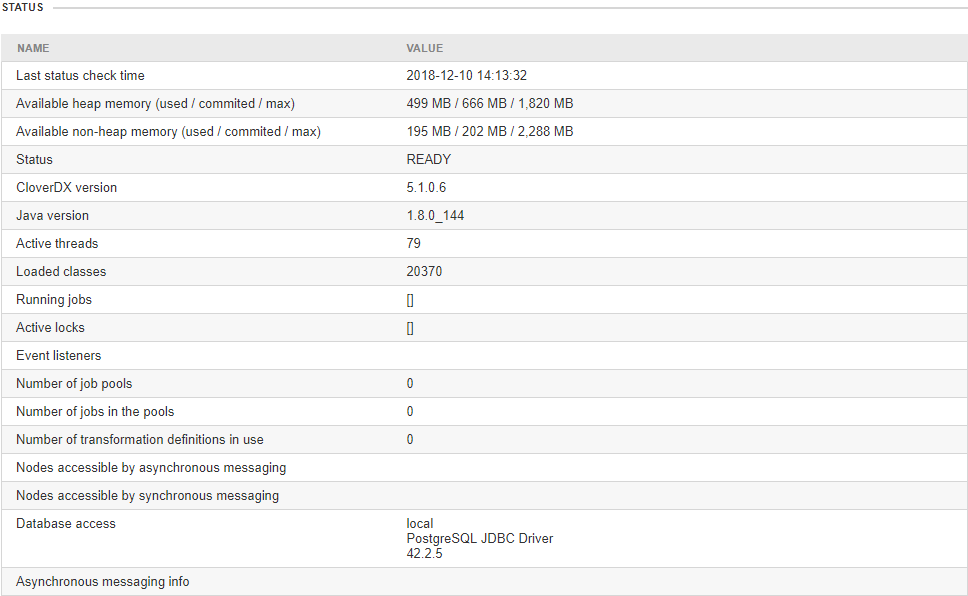
Figure 22.12. Status
Resource Utilization Detail
Provides information about CloverDX Server utilization of operating system resources.
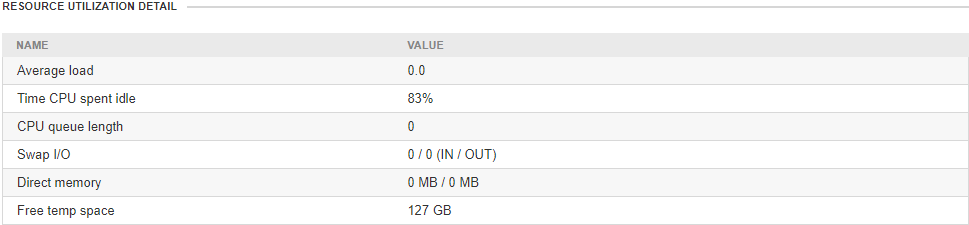
Figure 22.13. Status
Heartbeat
Heartbeat panel displays a list of heartbeat events and their results.
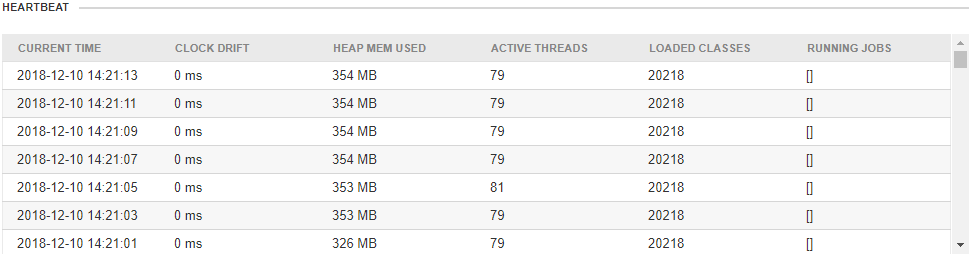
Figure 22.14. Heartbeat
Threads
Threads panel lists Java threads and their states.
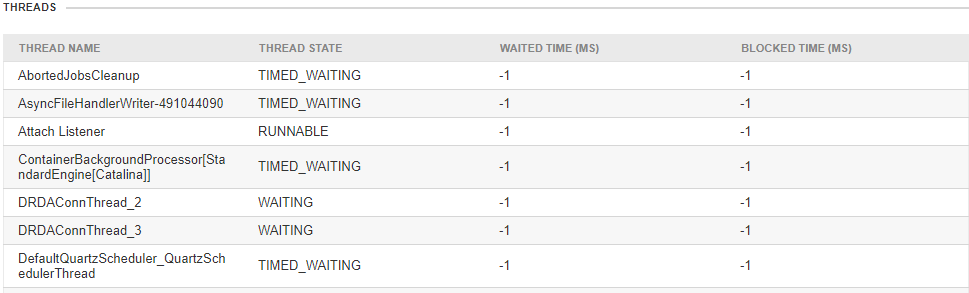
Figure 22.15. Threads
Quartz
Quartz panel lists scheduled actions: their name, description, start time, end time, time of previous event, time of next event and expected final event.
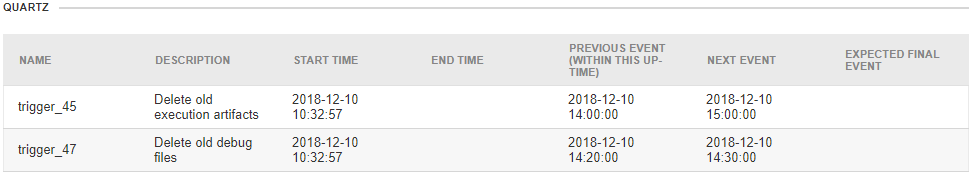
Figure 22.16. Quartz